Bellflower, CA, USA apartments for rent
$7,800
$7,800
Available: Right Now
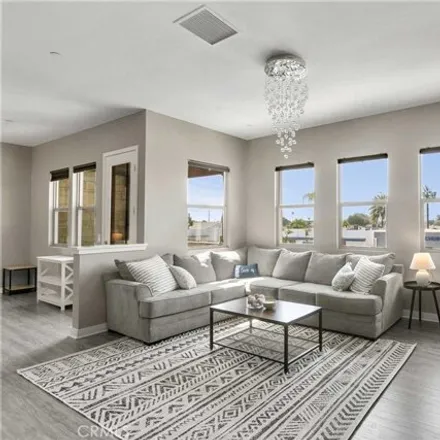
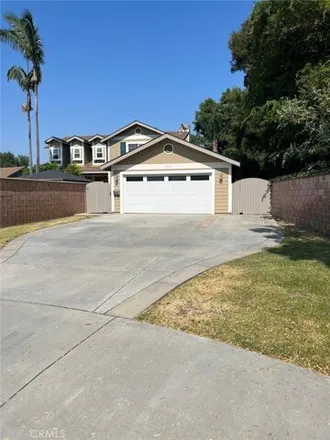
Welcome to this exquisite townhouse nestled on Alondra Blvd, offering a serene and inviting retreat in the heart of Bellflower, California. With four bedrooms and three bathrooms, this tastefully designed residence provides ample space for relaxation...

$3,600
$3,600
Available: Right Now
Our resort provides a wide range of first-rate amenities that are intended to make your stay unforgettable. At our well-equipped exercise center, stay active and keep up your fitness regimen. Enjoy the comfort of our magnificent villas, which come wi...
$1,500
$1,500
Available: Right Now
This listing is to rent one bedroom in a 3 bedroom home not the entire property. Owner occupies the primary bedroom with bathroom and the garage. He is rarely home, usually a couple of days every 4-6 months. Home features living room, family room, 3 ...

$10,800
$10,800
Available: Right Now
Have fun at this out door entertainment home that is centrally located to all the shopping centers, Disneyland, Knotts, and Beaches. Family friendly and open space for every age to enjoy.Residential neighborhood.A keyless entry.Gorgeous a...

$10,440
$10,440
Available: Right Now
Discover a bohemian oasis in Bellflower, California. This one-bedroom, one-bathroom getaway radiates eclectic charm, perfect for a laid-back West Coast retreat. Explore Downtown Bellflower's vibrant shops and eateries, or indulge in nearby theme park...
$3,000
$3,000
Available: Right Now
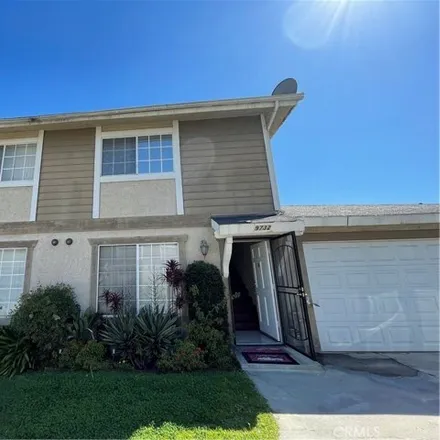
End Unit with a cute backyard. Move In Ready! Close to public access and very walkable. 2 good size bedroom upstairs. Convenient powder room in living room with a separate entry to garage. Spacious living room with fireplace leading to an open kitche...

$3,600
$3,600
Available: Right Now
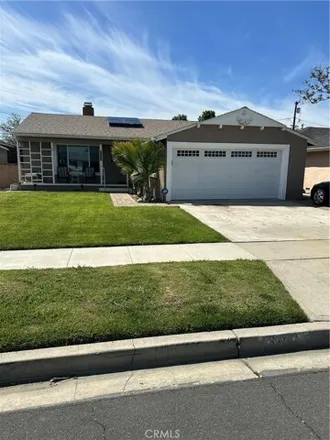
This could be your beautiful spacious 3 Bd 1.5 Bath home. The spacious floorplan features a great size living Room w/vaulted ceilings that opens up to a den w/brick fireplace and flows into the Dining Room. 12' continuous New Kitchen countertops and ...

$2,400
$2,400
Available: Right Now
Back Upstairs Unit - No One Below You - 2 Bedrooms 1 Bath 2 Car Parking. Open floor plan, spacious bedrooms, lots of closet space, wood-vinyl flooring throughout, wall air conditioning unit, ceiling fan in dining area. Two car covered parking, commun...
$10,590
$10,590
Available: Right Now
Relax and unwind with your friends and family in this inviting 3-bedroom, 1.5-bathroom townhouse. Centrally located, it's just a short drive (5-13 miles) from popular attractions like Disneyland, California Adventure, Knotts Berry Farm, Queen Mary, D...
$4,300
$4,300
Available: Right Now
New Lease in Bellflower Contemporary Luxury renovated two-story Home, 3 bedrooms 2 baths home featuring modern upgrades like a newly Kitchen. Bright Living room leads to dining room.Plus an extra family room. A slinging glass door leads to your priva...
$7,200
$7,200
Available: Right Now
Our resort provides a wide range of first-rate amenities that are intended to make your stay unforgettable. At our well-equipped exercise center, stay active and keep up your fitness regimen. Enjoy the comfort of our magnificent villas, which come wi...
$9,030
$9,030
Available: Right Now
*** Actual furnishings/decor may differ due to product changes and enhancements ***Welcome to this exquisite townhouse nestled on Alondra Blvd, offering a serene and inviting retreat in the heart of Bellflower, California. With four bedrooms and ...

$2,340
$2,340
Available: Right Now
Room rental. Shared living space. This 4 story home boasts over 2,000 sq ft of living space. Newer built community. 3 private rooms each with their own walk in closet and connected bathroom. Two separate living areas. One on the second floor next to ...
$3,900
$3,900
Available: Right Now
Great, quiet location. Near popular attractions and freeways.Yard is very spacious and clean. Enjoy some quiet time by the fire pit, shoot some hoops, have a picnic, grill something to eat, or stay indoors watching your favorite tv shows on Hulu ...

$8,400
$8,400
Available: Right Now
The house requires a minimum 31-day stay and utilities are not included.Welcome to this exquisite townhouse nestled on Alondra Blvd, offering a serene and inviting retreat in the heart of Bellflower, California. With four bedrooms and three bathr...

$13,860
$13,860
Available: Right Now
You'll have a great time at this comfortable place to stay near Los Angeles and Orange County at once. You get 1 Free Parking space. Walking distance from restaurants and bars in the Downtown Bellflower area. Only 5-25 min fromDTLA,Arts Distr...

$3,600
$3,600
Available: Right Now
Our resort provides a wide range of first-rate amenities that are intended to make your stay unforgettable. At our well-equipped exercise center, stay active and keep up your fitness regimen. Enjoy the comfort of our magnificent villas, which come wi...
$4,290
$4,290
Available: Right Now
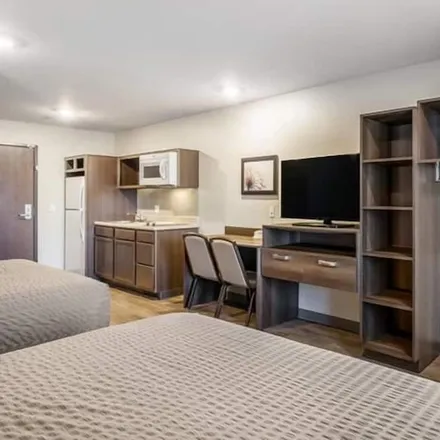
It’s easy to get the basics on a budget when you stay at our rooms in Bellflower. Our comfortable accommodations provide you with amenities for a good night, so you can wake up rested and ready to start your day. Premium bedding, free WiFi, a refrige...
$5,160
$5,160
Available: Right Now
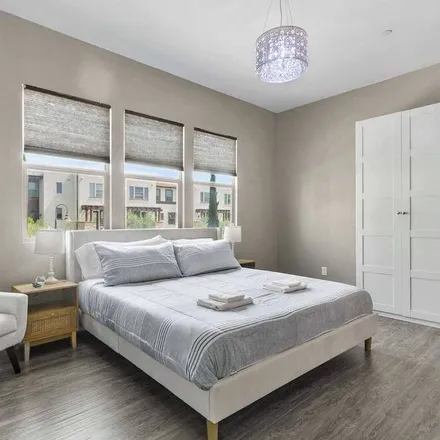
Welcome to our cozy and comfortable home in the City of Bellflower. Our fully furnished unit offers all the amenities you need for a pleasant and enjoyable stay! You'll be just a short drive away or even walking distance from a variety of shops, rest...

$1,488
$1,488
Available: Right Now
This listing is to rent one bedroom in a 3 bedroom home not the entire property. Owner occupies the primary bedroom with bathroom and the garage. He is rarely home, usually a couple of days every 4-6 months. Home features living room, family room, 3 ...

$2,900
$2,900
Available: 01/08/2024
House for rent in/on/near 17620 Windward Terrace. The monthly rent is $2,900, and the security deposit is $3,100, but you can submit your custom offer on this house and negotiate. This 1254-square-feet 2 bedroom house features 2.5 bathroom. Pleas...
$2,650
$2,650
Available: Right Now
Quiet End Unit! Recently upgraded cozy home with new kitchen cabinets and counter. Jack and jill half bath entry both from garage and living room. Close to freeway, shopping and transportations. Laundry hookup in garage. Bring you luggages, furniture...
Bellflower
Bellflower, CA has a population of 77,852, while the median age is 34. The household income in Bellflower, CA is around $52,944. The homeownership rate among the residents is 40%. The median residential property value in Bellflower, CA that you should keep in mind is $398,000.
| Population | 77,852 |
| Median Age | 34.1 |
| Poverty Rate | 15% |
| Household Income | $52,944 |
| Number Of Employees | 35,087 |
| Median Property Value | $398,000 |
What is the Average Rent for Bellflower, CA Apartments?
The average rent for apartment in Bellflower, CA: $2,749
(-2.9%)
| Month | Median Price |
|---|---|
| Jun 2024 |
$3,138
|
| May 2024 |
$2,981
|
| Apr 2024 |
$3,083
|
| Mar 2024 |
$3,083
|
| Feb 2024 |
$3,083
|
| Jan 2024 |
$3,083
|
| Month | Median Price |
|---|---|
| Jun 2024 |
$2,749
|
| May 2024 |
$2,830
|
| Apr 2024 |
$3,160
|
| Mar 2024 |
$3,160
|
| Feb 2024 |
$3,160
|
| Jan 2024 |
$3,160
|
Be informed and make custom offers based on median rent prices. However, keep in mind that the price may vary depending on the size and amenities of the apartments for rent.
Renter's FAQ About Bellflower, CA
-
What types of properties are available for rent in Bellflower?
Bellflower offers a variety of rental options to suit different needs and preferences. You can find apartments, houses, duplexes, condos, and rooms for rent.
-
What amenities can I expect to find in rental properties in Bellflower?
Rental properties in Bellflower may offer a range of amenities based on your requirements. Some popular amenities include parking facilities, gardens, air conditioning, dishwashers, and options that are considered student-friendly.
-
Is Bellflower a suitable location for young families?
Bellflower can be an excellent location for young families. It offers a family-friendly environment with various parks, schools, and recreational activities. Additionally, the city provides access to quality healthcare facilities and is in close proximity to educational institutions, making it convenient for families with children.
-
Is public transportation easily accessible in Bellflower?
Yes, public transportation options are readily available in Bellflower. The city is served by several bus routes, offering convenient connections to neighboring areas. Additionally, proximity to major freeways allows for easy commuting within the region.