Claremont, CA, USA apartments for rent
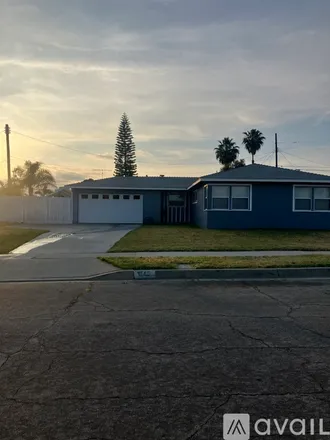
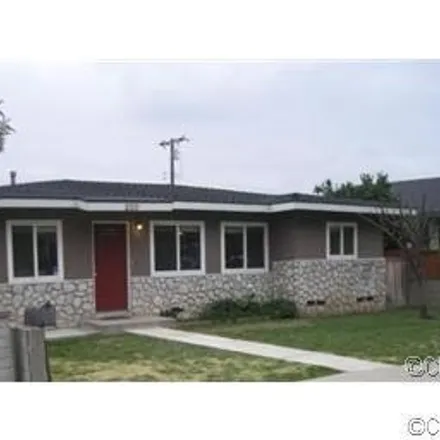
$3,500
$3,500
Available: 15/06/2024
Quiet Neighborhood near schools, park, and shopping center! You will enjoy making this cozy space your new home! On the border of Claremont! This home features 3 bedrooms, 2 bathrooms, and 1,508 sq ft of living space. The property is perfect for some...

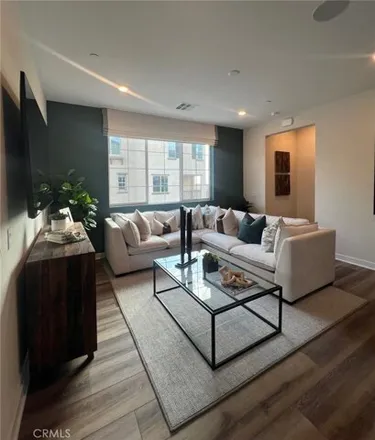
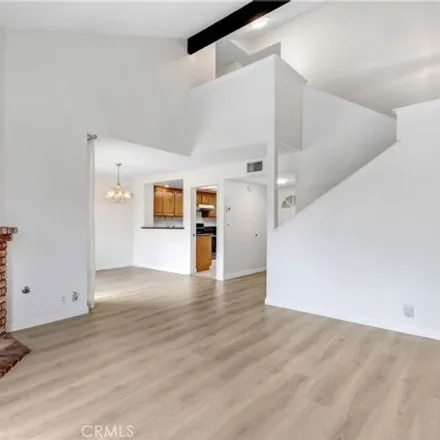
$2,850
$2,850
Available: Right Now
Welcome Home to the Arrow Station community! This unit is located in a prime location and offers many upgrades including tile flooring on the main floor including all baths and carpeting on the staircase and bedrooms. On the Ground level find a two-c...
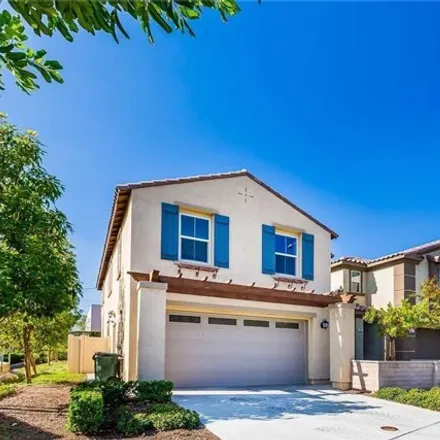
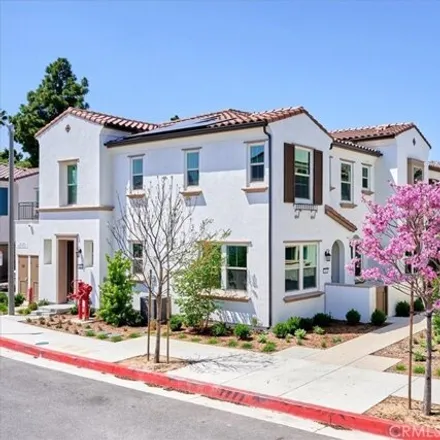
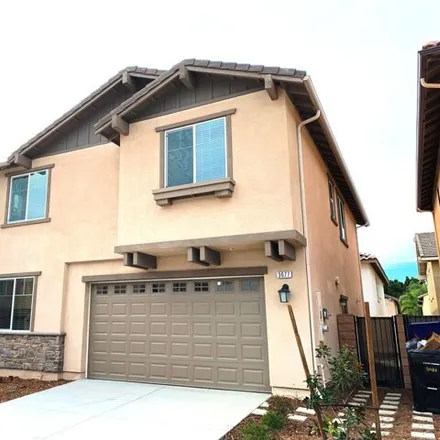
$4,500
$4,500
Available: Right Now
Brand New Model Home!! You can be the first family to live in this beautiful Brand New Model Home!!! This model home comes with everything. Fully furnished home with all the new stainless steel appliances (except washer and dryer). Furniture like all...

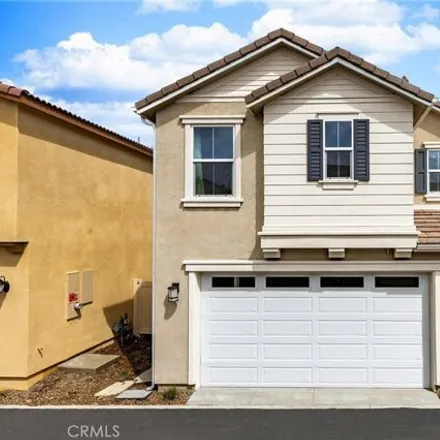
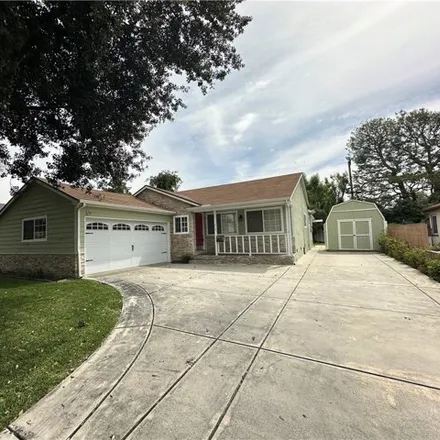
$2,750
$2,750
Available: Right Now
Welcome to this charming retreat nestled within the Oak Arbor Villas in Claremont where comfort and convenience harmonize seamlessly. From its welcoming exterior to its thoughtfully curated interior, this property is sure to captivate your heart. Ste...
$7,500
$7,500
Available: Right Now
Actual furnishings/decor may differ due to product changes and enhancements Utilities are pre-set up however tenant pays what they use This is a furnished rental Pricing reflects four (4) months or longer lease term. Shorter lease terms are available...
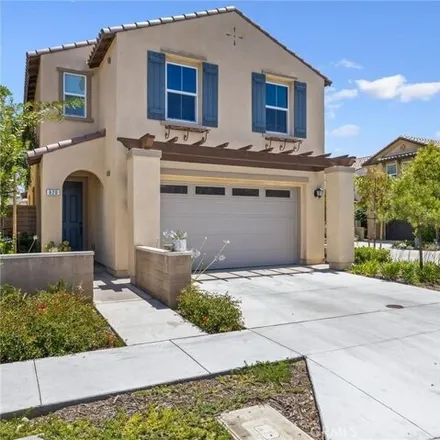
$3,650
$3,650
Available: Right Now
A beautiful detached home that used to be the builder's model home. No back neighbor. This property features 3 bedrooms and 2.5 bathrooms with an open floorplan. The kitchen has white cabinets, granite countertops, and stainless steel appliances. Flo...
$2,850
$2,850
Available: Right Now
Adorable, fully upgraded home, perfect for a small family! Centrally located near freeways and within walking distance of the metrolink! Enjoy gorgeous upgraded kitchen with granite countertops and custom cabinets. Beautiful hardwood floors and fully...
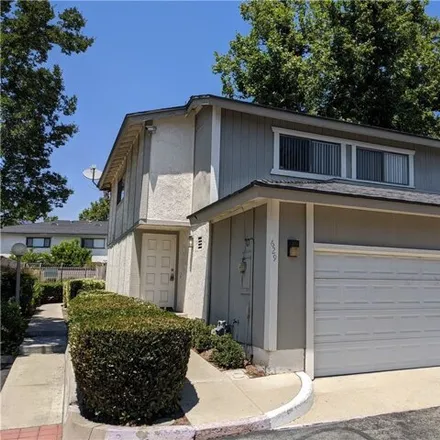
$3,600
$3,600
Available: Right Now
This beautiful 3 bedroom, 2.5 bath townhouse boasts an unbeatable location in Claremont, offering everything you need for comfortable living. Walk to shops and restaurants for easy errands, enjoy quick access to the 210 Freeway for commuting. This tw...

$3,500
$3,500
Available: 01/09/2014
Quiet Upscale north Claremont, Prestigeous Townhouse in Northern Claremont. Garden like quiet surrounding. 3 Bedrooms, 2 1/2Bathroom townhouse, just up the street from the prestigious Claremont Colleges and top rated Claremont schools. Walking distan...
$4,800
$4,800
Available: Right Now
New construction in Docente at Old School House. This particular home has the most coveted floor plan of its community. Open, spacious and bright with natural light. The 3 bedrooms, 3 bathrooms layout flows comfortably. The downstairs hosts an oversi...

$8,910
$8,910
Available: Right Now
Located in a peaceful city in a safe neighborhood. Huge backyard, driveway, and front yard. Pets are welcome but need to be approved first. There its an extra cleaning fee for pets. The fee is based on the type of pet, size (lbs), and how many pets. ...

$4,100
$4,100
Available: Right Now
This 2022 newly built, beautifully designed 4-bedroom, 3.5-bath unit offers everything you need for a comfortable and stylish living experience. Enjoy luxurious vinyl faux wood flooring, plush carpeted stairs, sleek quartz countertops, and custom cab...

$2,000
$2,000
Available: Right Now
Stunning 1 bedroom, 1 bathroom attached ADU is located in the heart of Claremont. Full kitchen is equipped with stainless steel appliances, gorgeous cabinets and quartz countertops. Updated bathroom quality cabinets, tiled shower and flooring. This u...

$2,495
$2,495
Available: Right Now
DON' T let this one get away ! 1BD + Bonus room with built in cabinets + 2 ba single story house in the gated griswald townhomes hoa. approx 1465 sq. ft. kitchen with stove, dishwasher and microwave. living room with fireplace, new c...
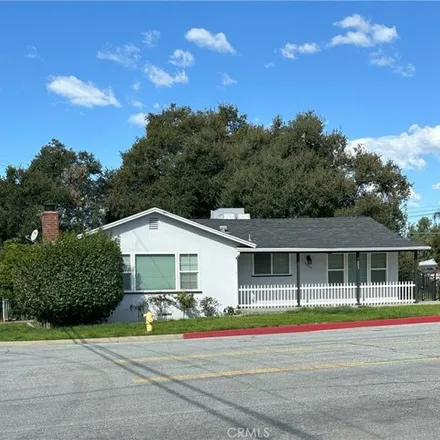
$4,000
$4,000
Available: Right Now
Beautifully upgraded 2 bedroom 2 bathroom mid-century traditional home. this home effortlessly blends the best of vintage charm with contemporary convenience. upon entering, you will be greeted by an open-concept living space that embodies a tradi...
$3,500
$3,500
Available: Right Now
Welcome Home! This two-story detached home in the Crestwood Community features a floor plan of2, 070square feet, with 4 bedrooms and 3 bathrooms. Situated just off the entry, the great room which enjoys ample windows for great natural light and boast...
$3,100
$3,100
Available: Right Now
Large Living Room and Bedrooms make this home a standout! Windows galore with lots of natural light! Natural stone entryway with a covered patio leads to a large, airy living room with a fireplace and lots of natural light, a large open kitchen with ...
$4,200
$4,200
Available: Right Now
Newer Construction in one of Upland's most beautiful private communities. The gated community resembles pulling up to a beautiful Cabo resort. Prime neighborhood location has the back yard facing the entrance, without any neighbors behind. Extremely ...

$3,500
$3,500
Available: Right Now
Unique Location in Northern Claremont. 3 Bedrooms, 2 1/2Bathroom townhouse. This home is in the Claremont Unified School District. The nearest schools are Chaparral Elementary School, El Roble Middle School and Claremont High School, within walking d...
$3,400
$3,400
Available: Right Now
Looking for a wonderful family to lease this poolside end-unit. Great opportunity to lease a 4 bedroom, 3 bath condo (2-story) in Claremont with Claremont Schools! This end-unit features a beautiful kitchen with granite counter-tops, stainless steel ...

$3,200
$3,200
Available: Right Now
Location, location ! Welcome home to this spacious 3 bedroom 2.5 bath gem in the great city of Montclair. As you enter, you are welcomed by bright open floorplan with 10ft ceilings and recessed lighting throughout beautifully illuminating the ...
$3,300
$3,300
Available: Right Now
Introducing a pristine Lennar model home now available for rent! Stunning 3-bedroom, 2.5-bathroom residence. This two-story abode boasts three bedrooms in total. On the upper floor, you'll find a versatile loft space, alongside two additional bedroom...
Claremont
Claremont, CA has a population of 35,949, while the median age is 40. The household income in Claremont, CA is around $96,923. The homeownership rate among the residents is 66%. The median residential property value in Claremont, CA that you should keep in mind is $605,700.
| Population | 35,949 |
| Median Age | 39.5 |
| Poverty Rate | 9% |
| Household Income | $96,923 |
| Number Of Employees | 17,184 |
| Median Property Value | $605,700 |
What is the Average Rent for Claremont, CA Apartments?
The average rent for apartment in Claremont, CA: $2,844
(-11.4%)
| Month | Median Price |
|---|---|
| Jun 2024 |
$2,577
|
| May 2024 |
$2,751
|
| Apr 2024 |
$2,531
|
| Mar 2024 |
$2,531
|
| Feb 2024 |
$2,531
|
| Jan 2024 |
$2,531
|
| Month | Median Price |
|---|---|
| Jun 2024 |
$2,844
|
| May 2024 |
$3,211
|
| Apr 2024 |
$3,346
|
| Mar 2024 |
$3,346
|
| Feb 2024 |
$3,346
|
| Jan 2024 |
$3,346
|
Be informed and make custom offers based on median rent prices. However, keep in mind that the price may vary depending on the size and amenities of the apartments for rent.
Renter's FAQ About Claremont, CA
-
What types of properties are available for rent in Claremont, CA?
In Claremont, CA, you can find a variety of rental properties such as houses, apartments, condos, lofts, and rooms.
-
What amenities can I expect in rental properties in Claremont?
Rental properties in Claremont usually offer amenities like air conditioning, parking, dishwasher, fireplace, and some might even have a garden.
-
How does the rental application process work in Claremont?
The rental application process in Claremont typically involves submitting an application form with personal and financial information, providing references, and paying an application fee. Landlords may also require a credit check and employment verification as part of the process.
-
What are some popular residential areas in Claremont?
Claremont has several popular residential areas, including the Village Area, which offers a vibrant downtown atmosphere with shops, restaurants, and entertainment options. Other sought-after areas include College Heights, Oakmont, and North Claremont, known for their charming neighborhoods and proximity to schools and parks.