Glendale, CA, USA apartments for rent

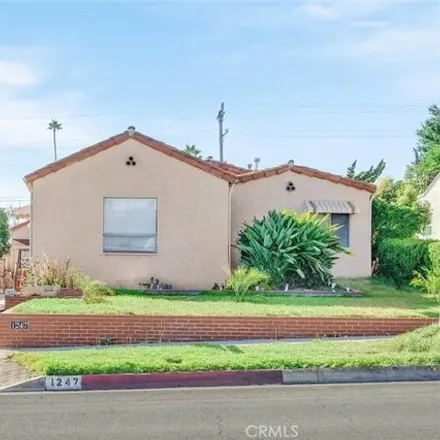
$6,000
$6,000
Available: 17/06/2024
Luxury living at its best. Beautiful Top Floor Corner Penthouse residence with amazing city views offers the best in lifestyle and luxury. This beautiful modern residence has it all. Italian designer kitchen with all Bosch built-in appliances, 20-fee...
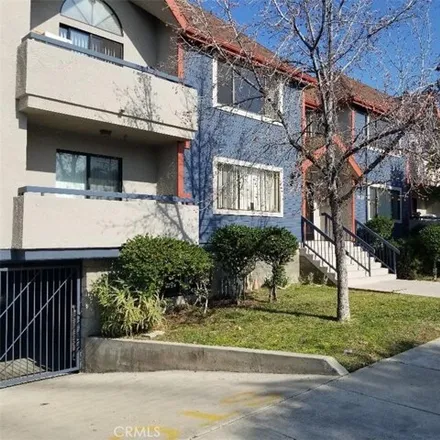
$2,100
$2,100
Available: Right Now
One Bedroom 1 Bath front, second floor unit facing toward Doran St. Central AC. Fresh paint. Brand new stove, dishwasher, hood. Master bedroom with walking closet and a good size balcony. Each floor has coin operating washer and dryer. Trash, hot and...

$11,900
$11,900
Available: Right Now
Perched high on a12, 000+ sqft lot in the highly desirable 91207 Glendale hills, this completely updated mid-century view home offers a luxurious retreat with 3, 600+ sqft of living space and breathtaking views, as far as Catalina Island. The single-...

$2,550
$2,550
Available: Right Now
Step into this beautifully Upgraded corner unit with mountain view from the living room to the kitchen that peek a boo in the bathroom. This property comes with a high vaulted ceiling and completely remodeled kitchen with french style bathroom. You w...

$3,600
$3,600
Available: Right Now
Rare find !! The property is located in a prime area, in a walking distance from Montrose Community Park, major stores (Vons/CVS), 2 FWY, and Montrose Town Center on Honolulu, where all shops and restaurants are located (farmers market on ...
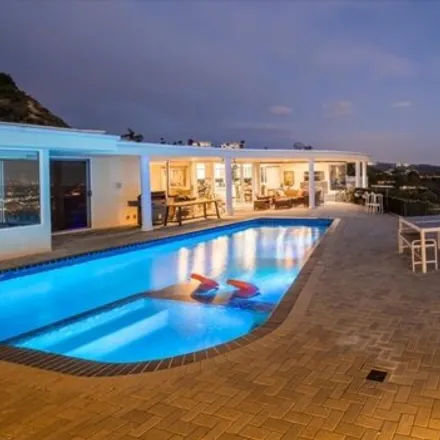
$13,250
$13,250
Available: Right Now
Perched in the Verdugo Hills of Glendale, this 4 bedroom, 4 bathroom- 3, 251sf - luxurious home boasts a heated pool and spa with stunning, unobstructed 180 degree views to the ocean, city lights and the San Fernando Valley. Featuring a formal entry ...
$11,000
$11,000
Available: Right Now
Pasadena Serenity Estate offers an exquisite living experience, combining modern luxury with the timeless charm of Pasadena. This elegantly appointed residence is thoughtfully designed to cater to the discerning tenant, with a focus on comfort, style...
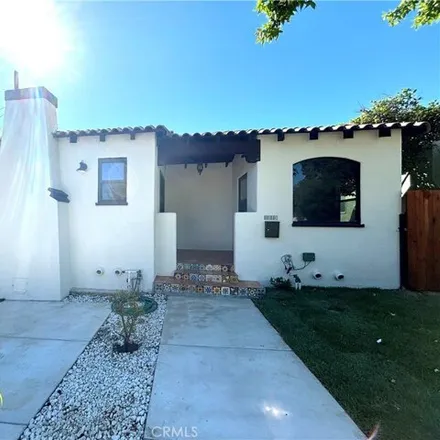
$7,200
$7,200
Available: Right Now
Discover a delightful blend of historic charm and modern elegance in this beautifully updated 1920s Spanish home, complete with a versatile Accessory Dwelling Unit (ADU). Step into the sunlit living room, where a large arched window bathes the space ...
$4,500
$4,500
Available: Right Now
Welcome to this exquisite 3 bed, 2 bath residence with a captivating Spanish design. Located just below Kenneth Road, this stunning home showcases the charm of Spanish architecture throughout. The expansive picture windows illuminate the living and f...
$2,995
$2,995
Available: Right Now
Incredible opportunity to rent in prime Glendale, with close proximity to the Americana at Brand/Galleria and the Pacific Park Community Center Complex that includes a library, community center, gated play park, community pool, and baseball field. Th...

$2,600
$2,600
Available: Right Now
Welcome to your new home in the heart of Burbank! This stunning 1-bedroom, 1-bathroom unit (with attached garage) has been completely remodeled and offers a perfect blend of modern amenities and classic charm. With a spacious living area and the open...
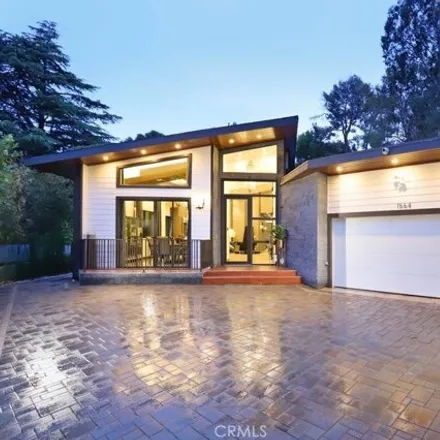
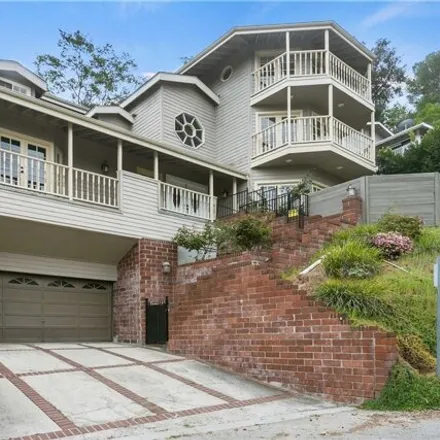
$15,000
$15,000
Available: Right Now
Secluded, Modern Lux custom built home in the Chevy Chase County Club Estates area meticulously designed w/walls of glass throughout.Approx. 15, 000sqft lot w/private and gated driveway.Enter the bright and formal foyer w/soaring ceilings, which open...

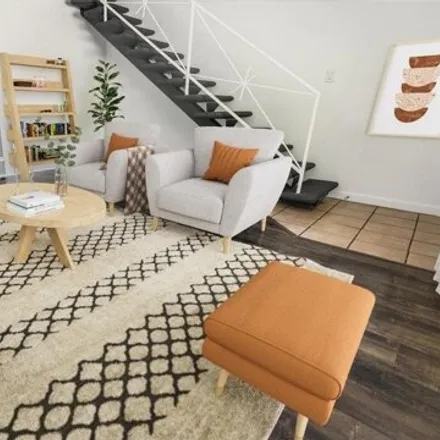
$5,460
$5,460
Available: Right Now
We would like to welcome you to our newly remodeled, modern, 1 Bedroom, 1 Full Bath, Apartment.The Bedroom has a King Size Bed and an 8 ft. sliding glass door that walks out on your own personal balcony with seating and lovely mountain views....

$8,600
$8,600
Available: Right Now
Brand New construction! This charming property is now available for rent and features 3 bedrooms, 4 bathrooms, and spans3, 000SqFt. It boasts recessed lighting throughout, a stunning fireplace, and a dedicated laundry room. The spacious family room i...

$1,700
$1,700
Available: Right Now
Welcome to your cozy retreat nestled in the heart of Highland Park, Los Angeles. This inviting 1 bedroom + 1 bath unit is located on the first-floor of a well-maintained four-plex. Enjoy the convenience of nearby Occidental College, along with a vibr...
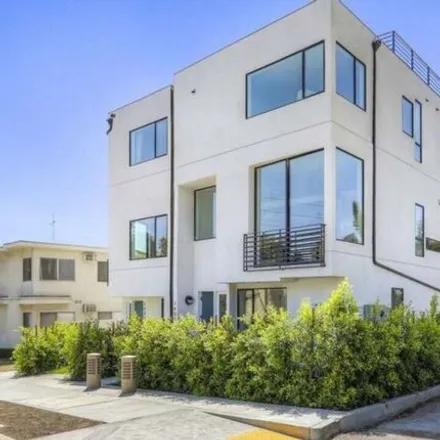
$6,500
$6,500
Available: Right Now
The Eagle Vista collection is an exclusive offering of six distinctive residences in the heart of Eagle Rock. Newer construction single-family homes designed to elevate modern living, this development features cutting edge and earthy elements to crea...
$4,500
$4,500
Available: 24/07/2024
This charming Sunland residence, boasting 3 bedrooms, 2 bathrooms, and 1,500 square feet, offers a blend of comfort and style that's illuminated by recessed lighting. This is a NEWLY renovated home. The expansive family room seamlessly integrates wit...

$2,595
$2,595
Available: Right Now
Modern, bright and freshly remodeled front facing one bed one bath now available in a prime Glendale, Building has undergone a beautiful top to bottom renovation that has everything you've been looking for. Black and white colors create a designer fe...

$2,207
$2,207
Available: Right Now
Welcome to this modern, single-level 1-bedroom, 1-bathroom apartment located in the city of Burbank. This unit is completely renovated and boasts tile flooring throughout, as well as convenient in-unit washer/dryer hookups. Situated in a charming cou...

$2,795
$2,795
Available: 26/07/2024
Beautiful 2-bedroom, 1-bathroom apartment has been completely renovated to offer you modern comfort and style. Enjoy the fresh and elegant look of new floors throughout the apartment and bright, clean walls with new paint that create a welcoming ambi...

$2,295
$2,295
Available: Right Now
Location, Location, Location. Located walking Distance to Glendale Galleria, The Americana, and Downtown Glendale Business District. No Car Needed. Welcome to this beautiful Executive studio ( Studio with divider to bedroom) apartment with 500 sqft o...

$4,500
$4,500
Available: Right Now
This newly available home in Sunland presents a comfortable living space with 3 bedrooms, 3 baths and1, 200SqFt of property. This is a two-story ADU with a spacious layout and abundant natural light, enhanced by recessed lighting throughout the house...
Glendale
Glendale, CA has a population of 199,750, while the median age is 41. The household income in Glendale, CA is around $58,657. The homeownership rate among the residents is 34%. The median residential property value in Glendale, CA that you should keep in mind is $675,300.
| Population | 199,750 |
| Median Age | 41.2 |
| Poverty Rate | 16% |
| Household Income | $58,657 |
| Number Of Employees | 96,119 |
| Median Property Value | $675,300 |
What is the Average Rent for Glendale, CA Apartments?
The average rent for apartment in Glendale, CA: $3,358
(-19.7%)
| Month | Median Price |
|---|---|
| Jun 2024 |
$3,451
|
| May 2024 |
$3,799
|
| Apr 2024 |
$2,698
|
| Mar 2024 |
$2,698
|
| Feb 2024 |
$2,698
|
| Jan 2024 |
$2,698
|
| Month | Median Price |
|---|---|
| Jun 2024 |
$3,358
|
| May 2024 |
$4,184
|
| Apr 2024 |
$3,929
|
| Mar 2024 |
$4,423
|
| Feb 2024 |
$4,423
|
| Jan 2024 |
$4,423
|
Be informed and make custom offers based on median rent prices. However, keep in mind that the price may vary depending on the size and amenities of the apartments for rent.
Renter's FAQ About Glendale, CA
-
What types of properties are available for rent in Glendale, CA?
In Glendale, CA, you can find a variety of rental properties such as apartments, houses, condos, duplexes, townhouses, and even individual rooms.
-
What are some popular amenities available in apartments for rent in Glendale, CA?
Apartments for rent in Glendale, CA often come equipped with amenities like air conditioning, parking spaces, dishwashers, gardens, and balconies to enhance your living comfort.
-
What is the rental application process like in Glendale, CA?
The rental application process in Glendale, CA typically involves filling out an application form, providing personal information, and submitting necessary documents such as identification, proof of income, and references. Landlords may also require a security deposit and a signed lease agreement.
-
What activities can one enjoy in their free time in Glendale, CA?
Glendale offers a range of recreational activities for residents to enjoy in their free time. You can explore the beautiful Descanso Gardens, visit the Glendale Galleria for shopping, or stroll along the Brand Boulevard of Cars, known for its car dealerships and occasional events. Additionally, there are numerous parks and hiking trails nearby for outdoor enthusiasts.
