Rancho Cucamonga, CA, USA apartments for rent
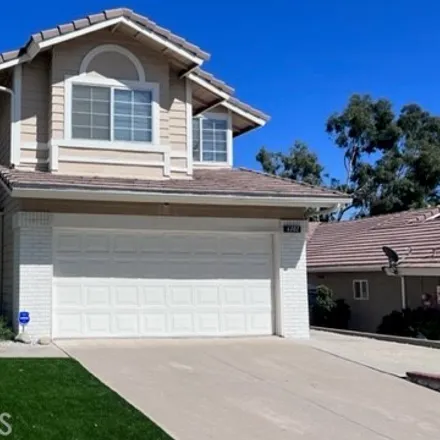
$3,400
$3,400
Available: Right Now
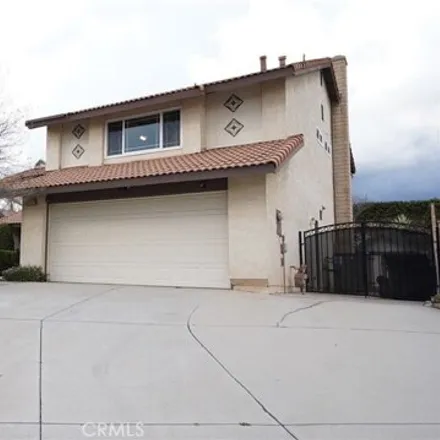
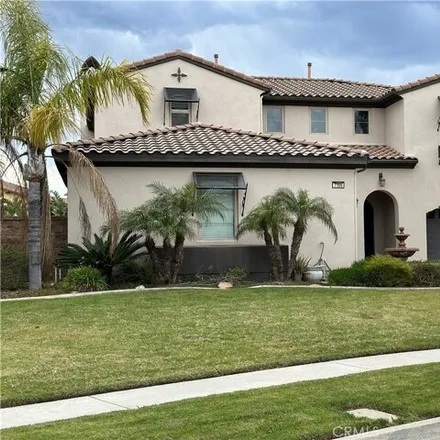
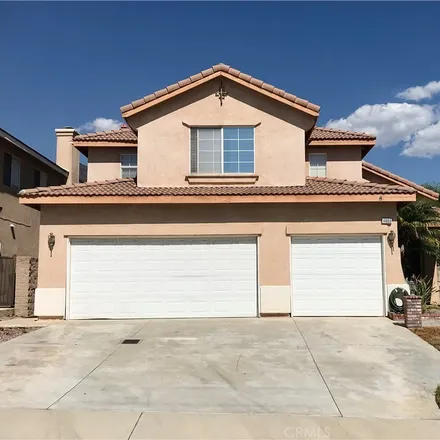
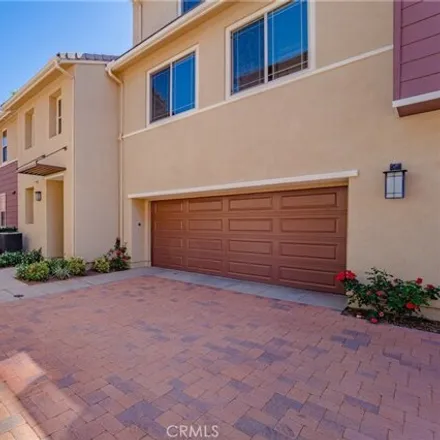
This gorgeous 2-story house is located at the top of a cul-de-sac with an extra long driveway. It features 4 bedrooms, 3 bathrooms, newly remodeled kitchen, 2 car attached garage, and a spacious backyard with a great mountain view. Close to highly ra...
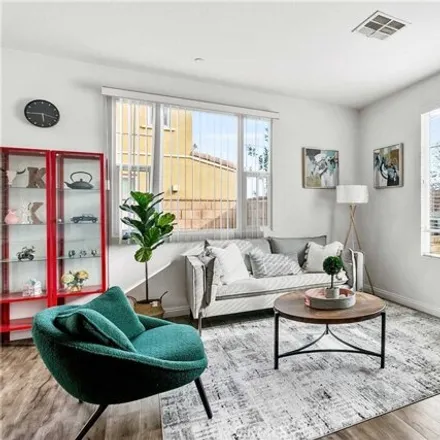
$3,000
$3,000
Available: Right Now
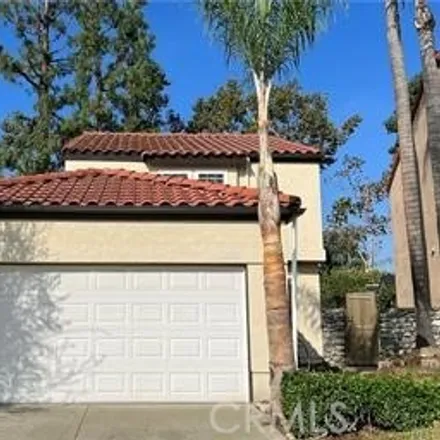
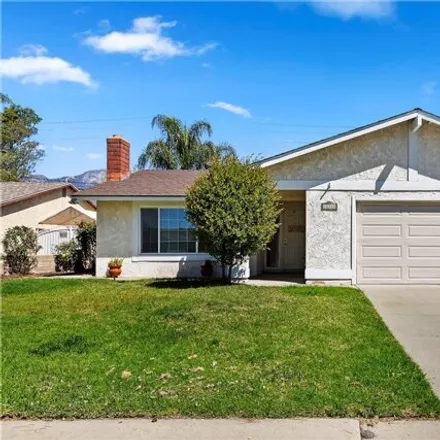
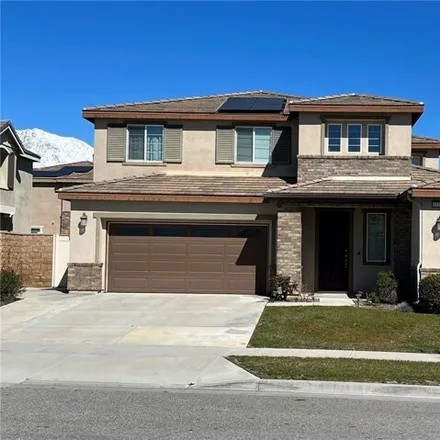
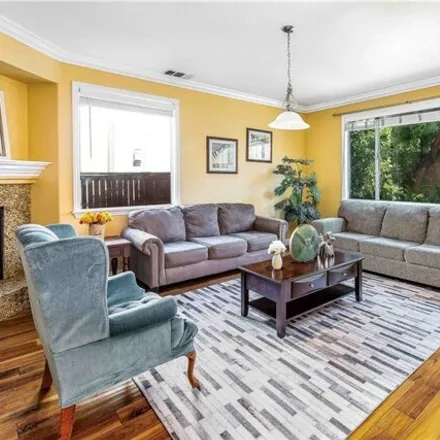
This is a beautifully remodeled home with an open concept floor plan, offering 3 bedrooms plus den downstairs and 2.5 bathrooms, new vinyl plank flooring with new baseboards, new interior paint throughout, and dual pane windows. Modern and stylish me...
$3,000
$3,000
Available: Right Now
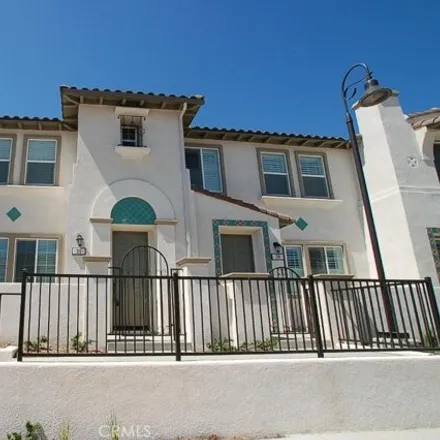
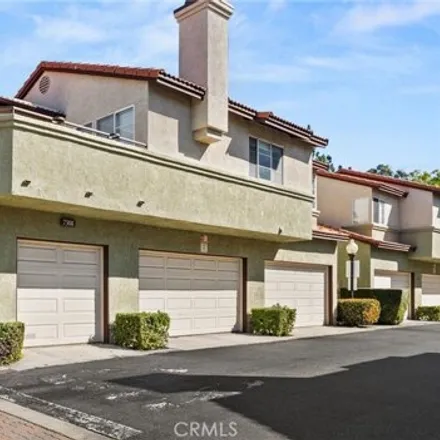
Peace and serenity meet modern day convenience at Elevage, a charming gated townhome community in Rancho Cucamonga. Crowned by the majestic San Gabriel Mountains and minutes to Victoria Gardens, Elevage is perfect for your family to live, play and gr...
$2,250
$2,250
Available: Right Now
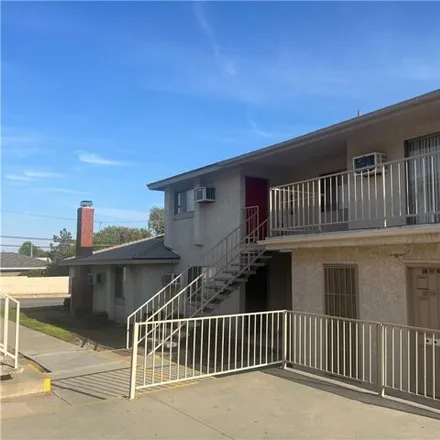
Recently renovated 2 bedroom, 1 bathroom apartment. Laminate flooring, ceiling fans in both bedrooms and in dining area. quartz counter top in kitchen. Large balcony. Nice clean unit. 1 carport space included in rent. No Pets. No Smoking. Easy freewa...
$3,200
$3,200
Available: Right Now
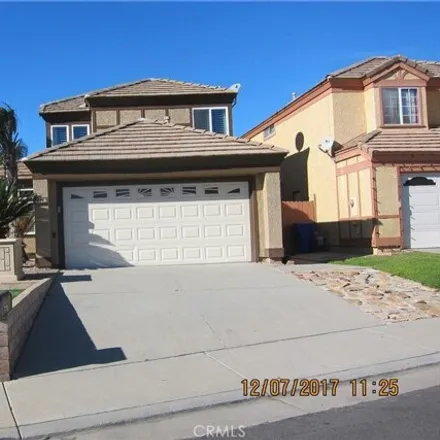
Beautiful cul-de-sac home within the sought-after Rancho Cucamonga area. Located in the Alta Loma School District, This Home Features 4 bedrooms, 2 baths, Living Room, Eating Area Off Kitchen, Swimming Pool and Direct Access to a 2 car garage. Covere...

$4,200
$4,200
Available: Right Now
Excellent location, high ceiling living room and formal dinning room, huge family room, upstairs loft, whole house has crown molding, whole house is wood floor and tile, large master bedroom and closet. Walking distance to John Golden Elemematry scho...
$3,200
$3,200
Available: Right Now
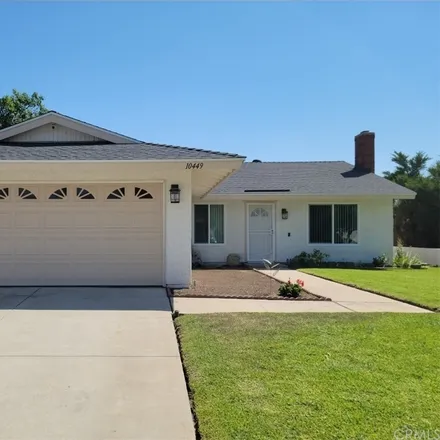
Discover your perfect single-story sanctuary in the heart of Rancho Cucamonga, where comfort meets style in this pristine home. Ideal for anyone eager to experience this sought-after neighborhood, the property boasts three inviting bedrooms, two bath...

$2,350
$2,350
Available: Right Now
Recently renovated 2 bedroom, 2 bathroom apartment. Laminate flooring, ceiling fans in both bedrooms and in dining area. quartz counter top in kitchen. cute little back patio. Nice clean unit. 1 carport space included in rent. No Pets. No Smoking. Ea...
$2,800
$2,800
Available: Right Now
Welcome to your new home at 7308 Greenhaven Avenue, Rancho Cucamonga! This charming upstairs unit condo offers comfortable living in a convenient location. Enjoy the community features which includes, a pool/spa, clubhouse, and the security of a gate...
$4,800
$4,800
Available: Right Now
Back on the market at no fault of the property owner. This beautiful rental property in Rancho Cucamonga boasts a spacious layout with 4 bedrooms and 2 bathrooms. The highlight is its expansive backyard featuring a sparkling pool and spa, perfect for...
$3,100
$3,100
Available: Right Now
$4,000
$4,000
Available: Right Now
This beautiful Rancho Cucamonga home is nestled in the Cornerstone gated community with 24/7 security guard service. This naturally lit house features the largest floor plan in the community with 4 bedrooms, 3 baths, 1 bed / 1 bath in downstairs. Big...
$2,200
$2,200
Available: 01/05/2024
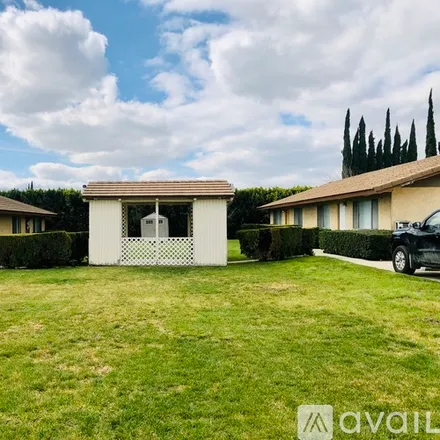
Beautiful, Spacious Duplex for RentThis is a lovely, spacious, quiet, Oasis like, 2 bedroom, 1 bathroom duplex with a 1 car enclosed detached garage, plus two parking spaces. There are only 4 units. This dwelling unit is 900 square feet with a ca...
$3,250
$3,250
Available: Right Now
Sweet Home located in the Terra Visa Community. 4 bedrooms. 3 full baths. One bedroom and full bath located downstairs. New Cooking Oven and brand new kitchen exhaust fan , tile wood looking floors all downstairs. Fire place in the cozy family room. ...
$3,600
$3,600
Available: Right Now
Available for a May Move-in If you ever wanted to live in the most prestigious condo complex in Rancho Cucamonga, Ca, now is your chance! Introducing 12444 Benton Dr #1. This unit offers you the most bang for your buck with appliances included. This ...
$2,300
$2,300
Available: Right Now
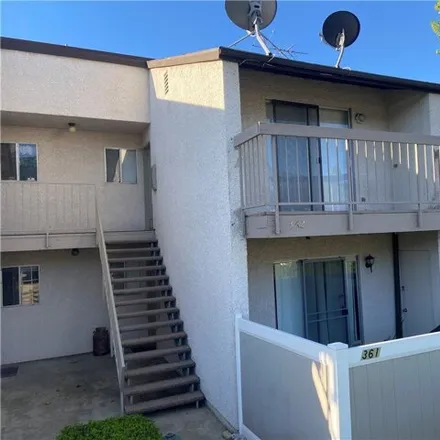
Available as of March 1, in Rancho Cucamonga = 2 bedrooms and 1 full Bathroom Top Floor Condominium = Private Balcony with Panoramic View of The San Gabriel Mountains = Property comes with a Stove, Microwave, and Dishwasher = Well Maintained Multiple...
$1,950
$1,950
Available: Right Now
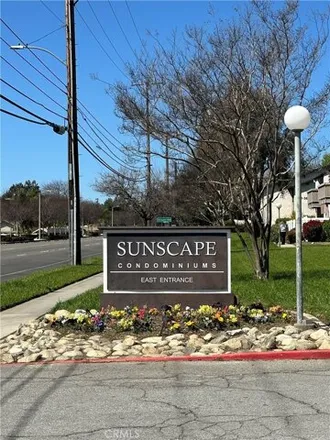
This 1 bed 1 bath condo is nestled in the Sunscape Community, offering convenient freeway access for commuters. Situated on the north side of Rancho Cucamonga, one of the Inland Empire's finest cities, this highly desirable community boasts outstandi...
$7,500
$7,500
Available: Right Now
Warm and inviting, take a rest with this sun soaked home in Rancho Cucamonga. With four spacious bedrooms, this sprawling2, 554sq. ft home is nestled in the highly acclaimed Etiwanda School District. Recent remodeling additions include upgraded grani...
$3,850
$3,850
Available: Right Now
This updated unit spans two levels, boasting its own two-car garage and a recent coat of fresh paint throughout. The kitchen is both bright and spacious, adorned with light-colored counters that illuminate the space. Crown molding accents the open fl...
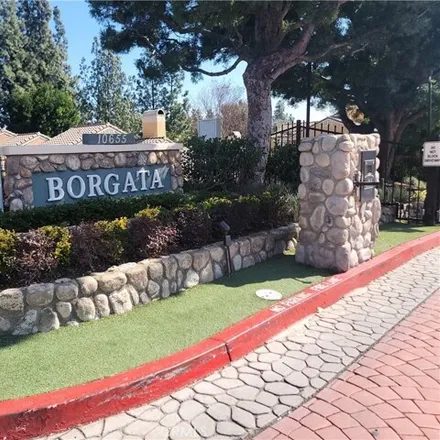
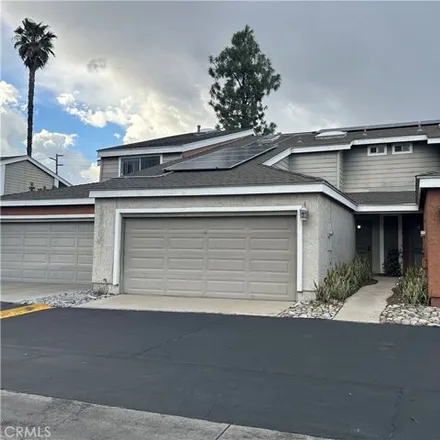
$2,100
$2,100
Available: Right Now
Located in the Borgata community in the foothills of Rancho Cucamonga. This property is situated in a prime location, north of the 210 freeway, and is part of a gated community. The community offers a tranquil and upscale living environment. This is ...
$7,500
$7,500
Available: Right Now
Discover the allure of Serenity Oasis, a 4-bedroom, 3-bathroom haven located in Rancho Cucamonga, California. Constructed in 2013, this residence invites you to experience luxury in an upscale community with amenities such as a refreshing pool and a ...
$3,200
$3,200
Available: Right Now
Rancho Cucamonga
Rancho Cucamonga, CA has a population of 174,573, while the median age is 36. The household income in Rancho Cucamonga, CA is around $83,736. The homeownership rate among the residents is 61%. The median residential property value in Rancho Cucamonga, CA that you should keep in mind is $444,200.
| Population | 174,573 |
| Median Age | 35.5 |
| Poverty Rate | 8% |
| Household Income | $83,736 |
| Number Of Employees | 84,885 |
| Median Property Value | $444,200 |
What is the Average Rent for Rancho Cucamonga, CA Apartments?
| Month | Median Price |
|---|---|
| Apr 2024 |
$3,237
|
| Mar 2024 |
$3,237
|
| Feb 2024 |
$3,237
|
| Jan 2024 |
$3,237
|
| Dec 2023 |
$3,125
|
| Nov 2023 |
$3,081
|
| Month | Median Price |
|---|---|
| Apr 2024 |
$3,739
|
| Mar 2024 |
$3,739
|
| Feb 2024 |
$3,739
|
| Jan 2024 |
$3,739
|
| Dec 2023 |
$3,407
|
| Nov 2023 |
$3,162
|
Be informed and make custom offers based on median rent prices. However, keep in mind that the price may vary depending on the size and amenities of the apartments for rent.
Renter's FAQ About Rancho Cucamonga, CA
-
What types of properties are available for rent in Rancho Cucamonga?
In Rancho Cucamonga, you can find a variety of rental properties to suit different needs and preferences. Some of the most popular types of properties include houses, condos, townhouses, apartments, lofts, rooms, and duplexes.
-
What are some popular amenities available in rental properties in Rancho Cucamonga?
Rental properties in Rancho Cucamonga often come with a range of amenities to enhance your living experience. Some of the popular amenities you might find include parking facilities, air conditioning for those warm California days, garden spaces for relaxation, swimming pools for recreational purposes, and even breathtaking beach views.
-
Which are the major employers in Rancho Cucamonga?
Rancho Cucamonga is home to several major employers, providing a range of employment opportunities. Some of the largest employers in the area include the City of Rancho Cucamonga, Chaffey College, Rancho Cucamonga School District, Victoria Gardens, and the San Bernardino County. These organizations contribute to the local economy and provide a variety of job options for residents.
-
Are there any useful resources for students in Rancho Cucamonga?
Students living in Rancho Cucamonga can benefit from various educational resources in the area. The city is served by the Chaffey Joint Union High School District and the Rancho Cucamonga School District, which provide quality education for students. Additionally, there are libraries and community centers that offer educational and recreational programs aimed at supporting the student community.