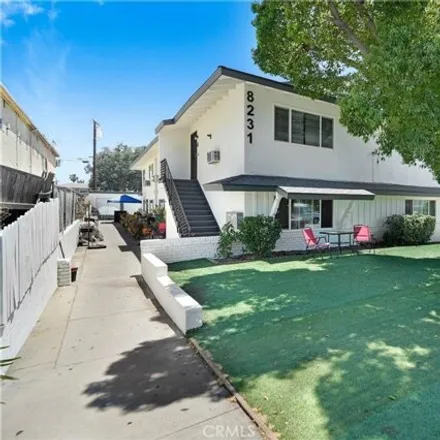
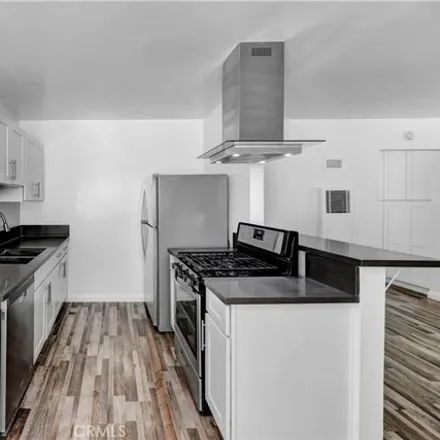
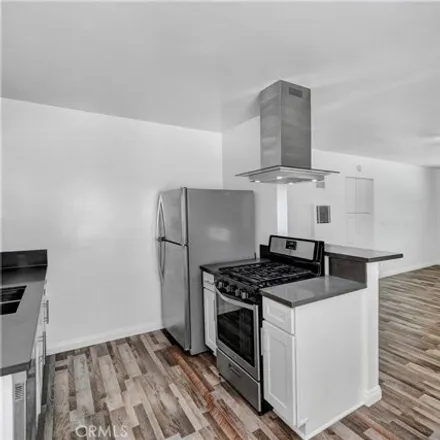
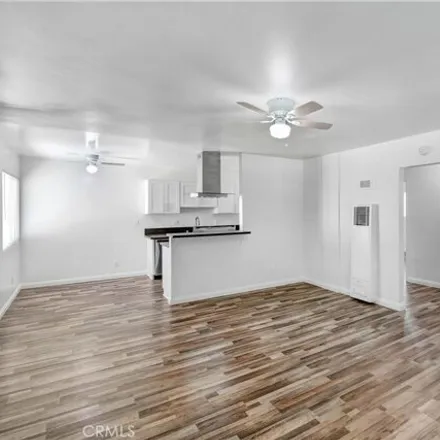
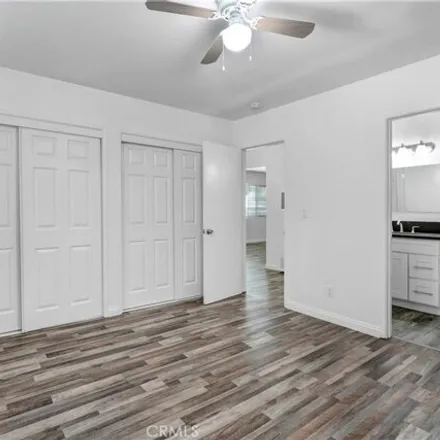
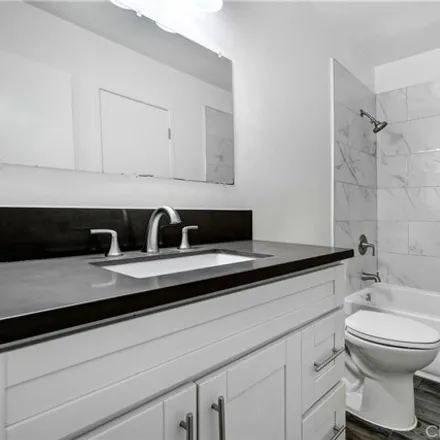
Home For Sale In Rancho Cucamonga, California
house for sale
Listed: 03/07/24
8285 Tapia Via Drive, Rancho Cucamonga, CA 91730, USA
12
Bed:
6
Bath:
5,508 Sq Ft
Living Area:
Save
Price
Show
6
more
About This House
Protect Yourself From Rental Scams
While we strive to provide accurate and timely information, it's essential to remain vigilant and do your due diligence when considering rental properties. Make sure to follow expert tips to reduce the risk of fraud when renting a new apartment.
Original listing
Copyright © 2024 Realtyww Info. All rights reserved. All information provided by the listing agent/broker is deemed reliable but is not guaranteed and should be independently verified.
Rancho Cucamonga Housing & Living
Household Income
Median household income:
$83,736
Number of households:
55,870
The average household income in
Rancho Cucamonga, CA
grew
from
$79,973
to
$83,736
in the past year. This data is an estimate based upon
55,870
households in
Rancho Cucamonga, CA.
The chart below presents how household income is distributed in Rancho Cucamonga, CA in comparison to the revenue allocation amid households nationally.
The chart below presents how household income is distributed in Rancho Cucamonga, CA in comparison to the revenue allocation amid households nationally.
Property Taxes
Average range: $3k+
One of the most important aspects for property owners is the amount of property taxes. This graph shows
distribution of property taxes in
Rancho Cucamonga, CA
compared to median property taxes around the country. The prevalent amount of property taxes in
Rancho Cucamonga, CA
equals
$3k+
, which is
more
than the national average.