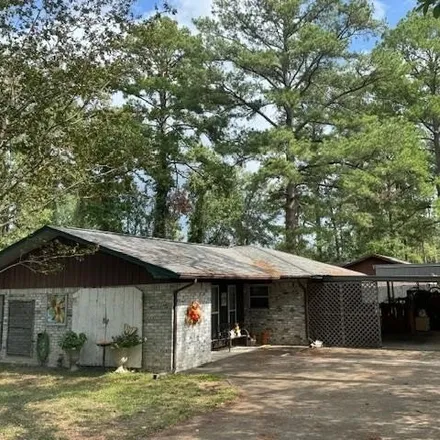
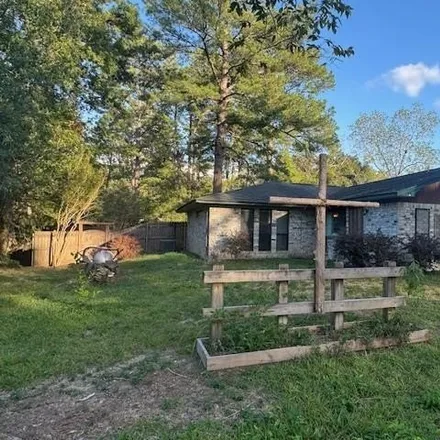
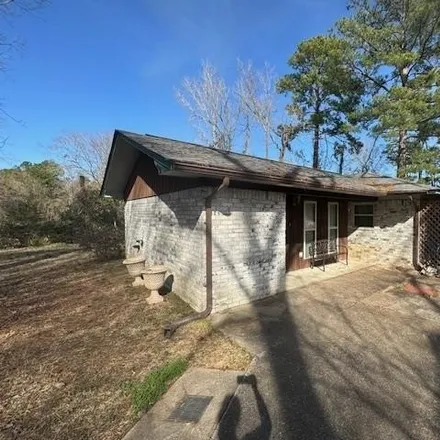
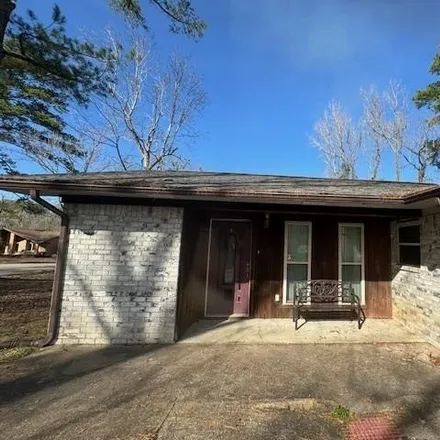
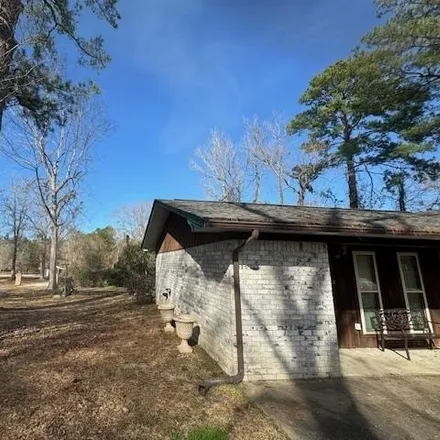
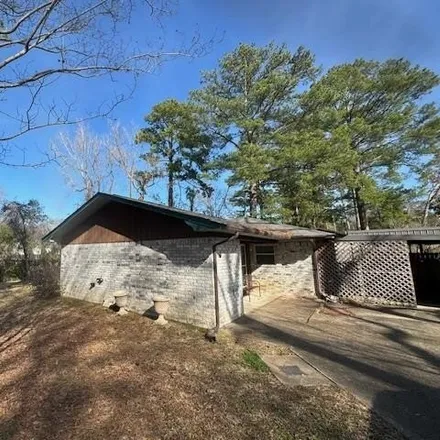
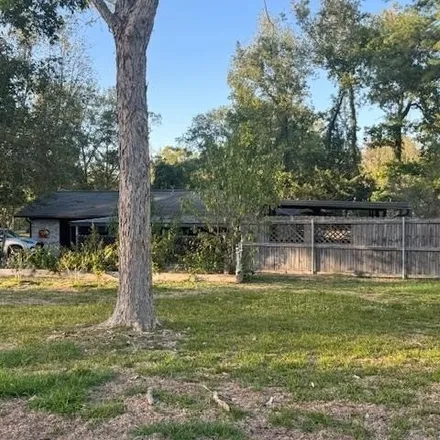
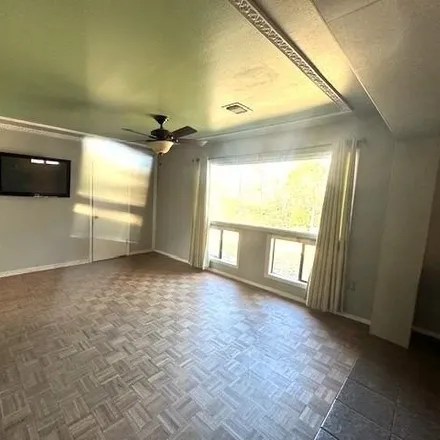
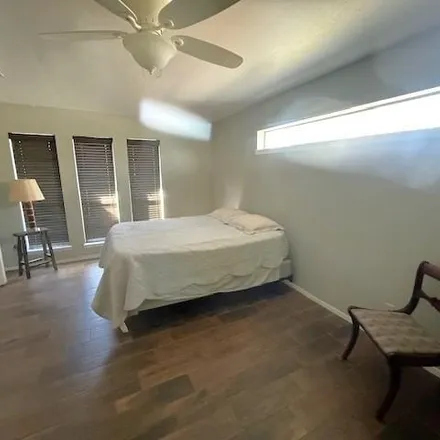
Home For Sale In Kirbyville, Texas
house for sale
Listed: 05/07/24
539 North Adams Avenue, Kirbyville, Jasper County, TX 75956, USA
2
Bed:
2
Bath:
1,568 Sq Ft
Living Area:
Save
Price
Show
6
more
About This House
Protect Yourself From Rental Scams
While we strive to provide accurate and timely information, it's essential to remain vigilant and do your due diligence when considering rental properties. Make sure to follow expert tips to reduce the risk of fraud when renting a new apartment.
Original listing
Copyright © 2024 Realtyww Info. All rights reserved. All information provided by the listing agent/broker is deemed reliable but is not guaranteed and should be independently verified.
Kirbyville Housing & Living
Household Income
Median household income:
$22,882
Number of households:
897
The average household income in
Kirbyville, TX
declined
from
$24,697
to
$22,882
in the past year. This data is an estimate based upon
897
households in
Kirbyville, TX.
The chart below presents how household income is distributed in Kirbyville, TX in comparison to the revenue allocation amid households nationally.
The chart below presents how household income is distributed in Kirbyville, TX in comparison to the revenue allocation amid households nationally.
Property Taxes
Average range: <$800
One of the most important aspects for property owners is the amount of property taxes. This graph shows
distribution of property taxes in
Kirbyville, TX
compared to median property taxes around the country. The prevalent amount of property taxes in
Kirbyville, TX
equals
<$800
, which is
more
than the national average.