

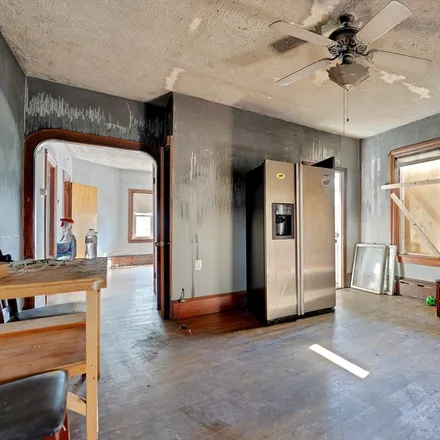


9 bedroom house in Fall River
house for sale
Listed: 06/25/24
66 Lyon St, Fall River MA 02721
9
Bed:
3
Bath:
2,523 Sq Ft
Living Area:
1900
Year Built:
Save
Price
Show
6
more
About This House
Property Includes
- Beach Front
- Bay
- Harbor
- Ocean
- 1/2 To 1 Mile To Beach
- Rain Gutters
- Living Room
- Dining Room
- Kitchen
- Other (See Remarks)
Protect Yourself From Rental Scams
While we strive to provide accurate and timely information, it's essential to remain vigilant and do your due diligence when considering rental properties. Make sure to follow expert tips to reduce the risk of fraud when renting a new apartment.
Original listing
Copyright © 2024 MLS PIN. All rights reserved. All information provided by the listing agent/broker is deemed reliable but is not guaranteed and should be independently verified.
Fall River Housing & Living
Average sale prices for houses
3 bed
4+ bed
Show as List
Show as Graph
| Month | Median Price |
|---|---|
| Jun 2024 |
$461,888
|
| May 2024 |
$501,900
|
| Apr 2024 |
$460,555
|
| Mar 2024 |
$460,555
|
| Feb 2024 |
$460,555
|
| Jan 2024 |
$460,555
|
In June 2024, the asking price for 3 bed houses for sale in/near Fall River, United States averaged $461,888, a decrease of 8% from the previous month.
Median price trends for properties for sale in Fall River, United States as of June 2024.
Household Income
Median household income:
$39,328
Number of households:
38,611
The average household income in
Fall River, MA
grew
from
$36,798
to
$39,328
in the past year. This data is an estimate based upon
38,611
households in
Fall River, MA.
The chart below presents how household income is distributed in Fall River, MA in comparison to the revenue allocation amid households nationally.
The chart below presents how household income is distributed in Fall River, MA in comparison to the revenue allocation amid households nationally.
Property Taxes
Average range: $2k-$3k
One of the most important aspects for property owners is the amount of property taxes. This graph shows
distribution of property taxes in
Fall River, MA
compared to median property taxes around the country. The prevalent amount of property taxes in
Fall River, MA
equals
$2k-$3k
, which is
more
than the national average.