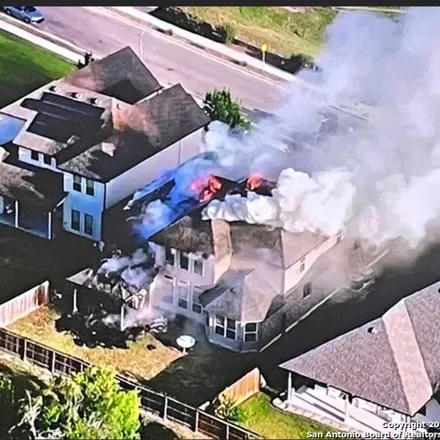
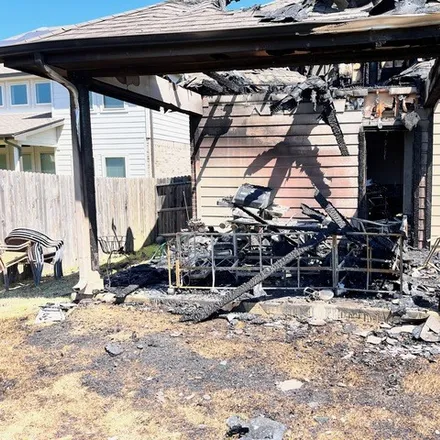
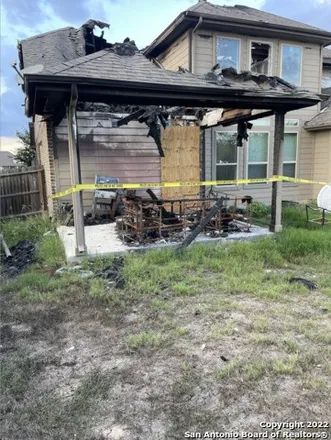
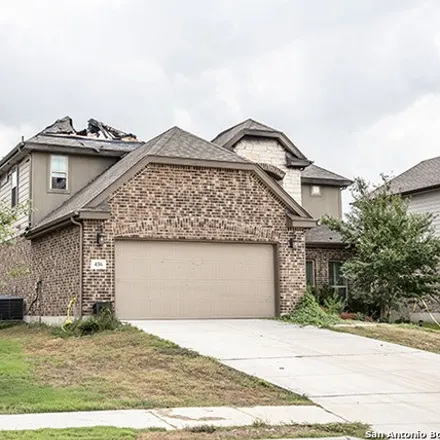
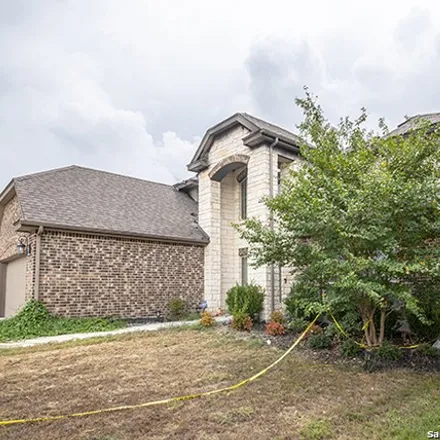
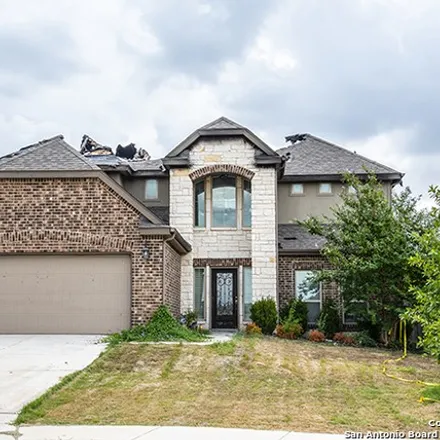
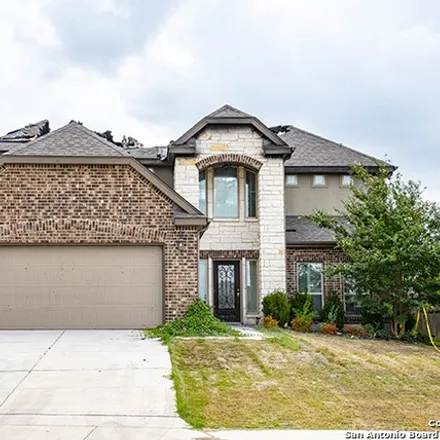
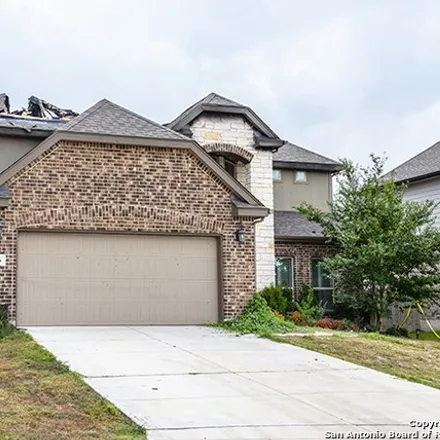
Single Family Detached
436 Turning Stone, Cibolo, TX 78108, USA
4
Bed:
4
Bath:
2,845 Sq Ft
Living Area:
Save
Price
Show
5
more
About This House
Property Includes
- Parking
- Air Conditioning
- Roof Composition Shingle
- Covering Floor Carpet
- Covering Floor Tile Ceramic
- Heating Central Furnace
- Fuel Heating Electric
Protect Yourself From Rental Scams
While we strive to provide accurate and timely information, it's essential to remain vigilant and do your due diligence when considering rental properties. Make sure to follow expert tips to reduce the risk of fraud when renting a new apartment.
Copyright © 2024 RentCatalogue. All rights reserved. All information provided by the listing agent/broker is deemed reliable but is not guaranteed and should be independently verified.
Cibolo Housing & Living
Average sale prices for houses
4+ bed
Show as List
Show as Graph
| Month | Median Price |
|---|---|
| Apr 2024 |
$387,380
|
| Mar 2024 |
$387,380
|
| Feb 2024 |
$387,380
|
| Jan 2024 |
$387,380
|
| Dec 2023 |
$402,877
|
| Nov 2023 |
$372,419
|
In April 2024, the asking price for 4 bed houses for sale in/near Cibolo, United States averaged $387,380, staying on the same level compared to the previous month.
Median price trends for properties for sale in Cibolo, United States as of April 2024.
Household Income
Median household income:
$92,773
Number of households:
7,963
The average household income in
Cibolo, TX
grew
from
$91,827
to
$92,773
in the past year. This data is an estimate based upon
7,963
households in
Cibolo, TX.
The chart below presents how household income is distributed in Cibolo, TX in comparison to the revenue allocation amid households nationally.
The chart below presents how household income is distributed in Cibolo, TX in comparison to the revenue allocation amid households nationally.
Property Taxes
Average range: $3k+
One of the most important aspects for property owners is the amount of property taxes. This graph shows
distribution of property taxes in
Cibolo, TX
compared to median property taxes around the country. The prevalent amount of property taxes in
Cibolo, TX
equals
$3k+
, which is
more
than the national average.