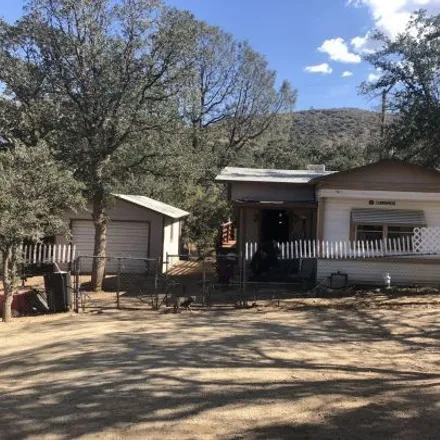
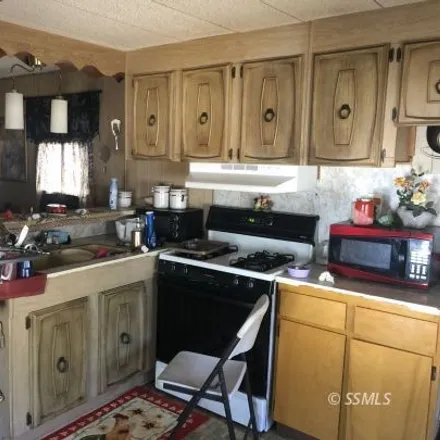
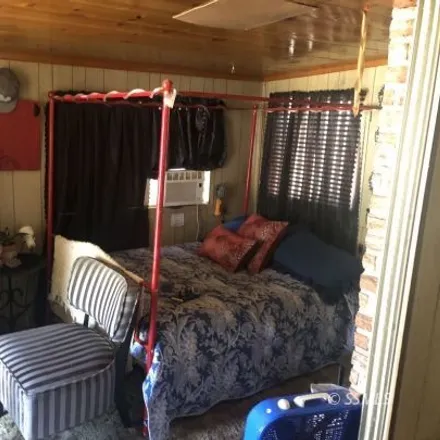
Mobile Home
105 Verna Street, Bodfish, Kern County, CA 93205, USA
2
Bed:
1
Bath:
700 Sq Ft
Living Area:
Save
Price
Show
6
more
About This House
Amenities
-
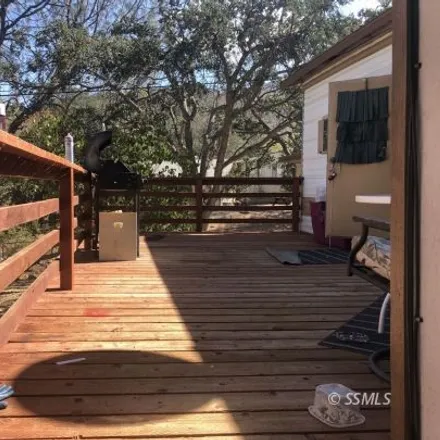
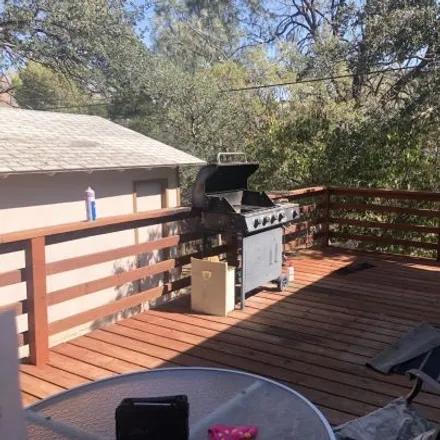
This house has a spectacular relaxation spot - a deck Roof Deck
Property Also Includes
- Parking
- Storage
- Roof Composition Shingle
- Covering Floor Carpet
- Heating Forced Air
- Fuel Heating Natural Gas
Protect Yourself From Rental Scams
While we strive to provide accurate and timely information, it's essential to remain vigilant and do your due diligence when considering rental properties. Make sure to follow expert tips to reduce the risk of fraud when renting a new apartment.
Copyright © 2024 RentCatalogue. All rights reserved. All information provided by the listing agent/broker is deemed reliable but is not guaranteed and should be independently verified.
Bodfish Housing & Living
Household Income
Median household income:
$23,684
Number of households:
718
The average household income in
Bodfish, CA
declined
from
$26,004
to
$23,684
in the past year. This data is an estimate based upon
718
households in
Bodfish, CA.
The chart below presents how household income is distributed in Bodfish, CA in comparison to the revenue allocation amid households nationally.
The chart below presents how household income is distributed in Bodfish, CA in comparison to the revenue allocation amid households nationally.
Property Taxes
Average range: <$800
One of the most important aspects for property owners is the amount of property taxes. This graph shows
distribution of property taxes in
Bodfish, CA
compared to median property taxes around the country. The prevalent amount of property taxes in
Bodfish, CA
equals
<$800
, which is
more
than the national average.
