Benicia, CA, USA apartments for sale
$725,000
$725,000
Available: Right Now
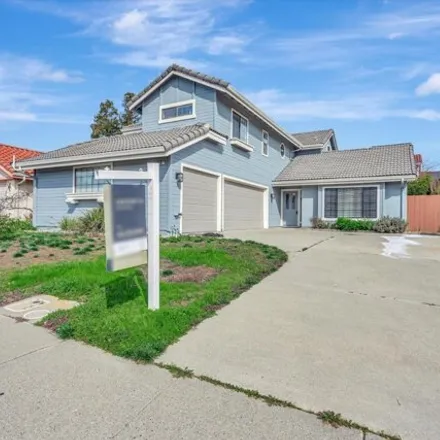
Welcome to your new home nestled in the heart of Vallejo. This spacious updated 4 bedroom 2.5 bathroom home in the East Vallejo Hills of the Aiden Heights neighborhood offers a perfect blend between private and functionality surrounded by golf course...
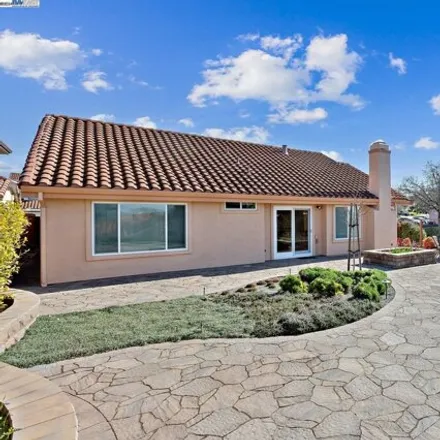
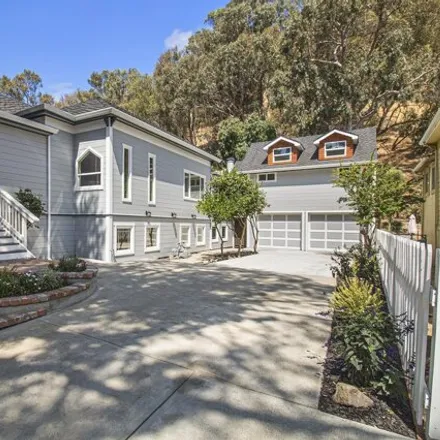
$1,79M
$1,79M
Available: Right Now
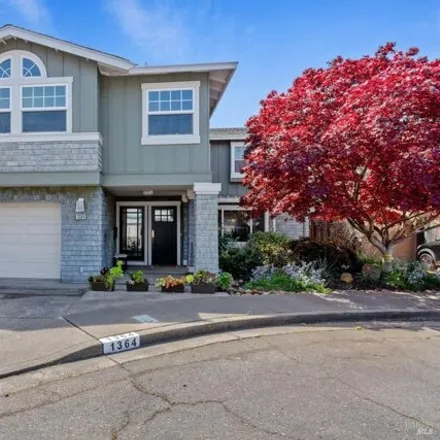
Incredible Water and Hill Views from almost every room!! Welcome Home to 1364 Bonita Bahia Court with In-Law Potential. This 4 bedroom and 3.5 bathrooms home boasts 3000' square feet. Attractive curb appeal with Batten Board and Shingle siding, beaut...

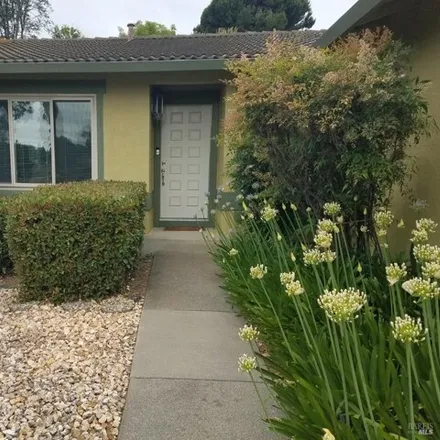
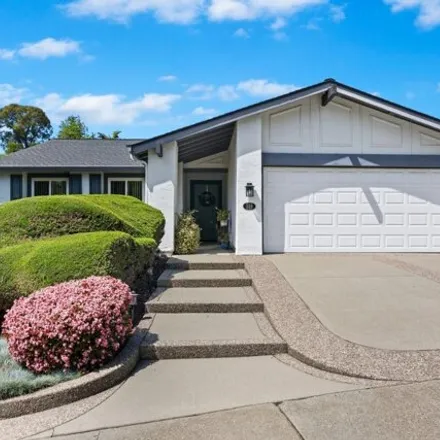
$685,000
$685,000
Available: Right Now
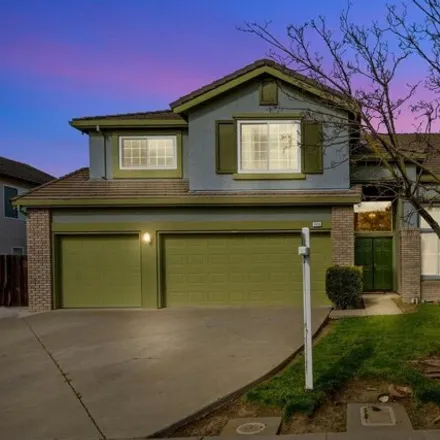
Welcome to this charming and inviting home nestled on a cul-de-sac in beautiful Benicia. This delightful property offers a comfortable and spacious living environment, perfect for those seeking a cozy retreat. As you enter you'll immediately notice t...
$895,373
$895,373
Available: Right Now
Nestled in the scenic Vallejo Hills right on the borderline of Benicia and Glen Cove area, this exquisite 5-bed, 3-bath home at 1015 Sandhurst Dr. offers an unparalleled living experience. Boasting a generous2, 827square feet of living space and situ...

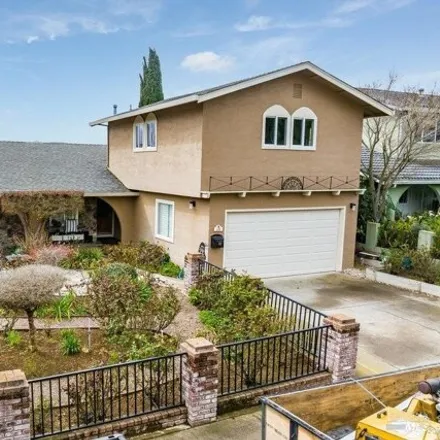
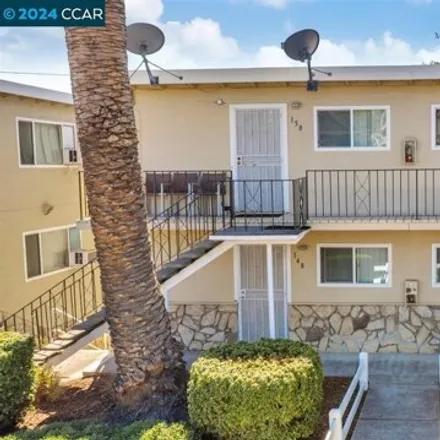
$890,000
$890,000
Available: Right Now
Introducing a unique opportunity to own a property with two homes on one lot. The first unit (184) features 3 bedrooms and one bath. It has an outdoor laundry porch/sink. With a basement below there is plenty room for storage. The second unit (180) o...
$595,000
$595,000
Available: Right Now
Very nice townhouse in lovely Benicia. Located off Southampton close to shopping, schools and easy connection to commute to bay area. Walking path near townhouse offers quiet spot to stop, take in the water views and enjoy the sunsets. Small water vi...
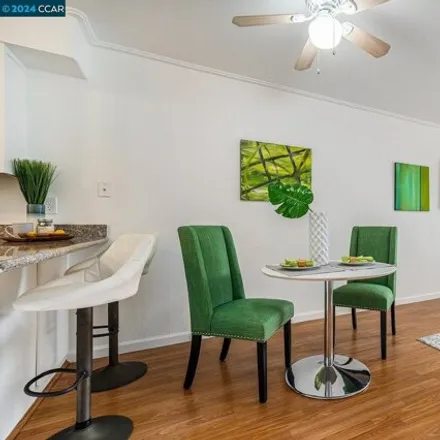
$675,000
$675,000
Available: Right Now
Welcome home! This meticulously maintained residence boasts a spacious layout spanning1, 545sqft, offering an ideal blend of comfort and elegance. Upon entering, you'll be greeted by the inviting ambiance of vaulted ceilings that enhance the sense of...
$839,000
$839,000
Available: Right Now
Experience this renovated 4-bedroom, 3-bathroom home, rich with 53 years of memories. This property seamlessly blends history and contemporary living. Approaching the house, you're greeted by the timeless beauty of a meticulously tended rose garden t...
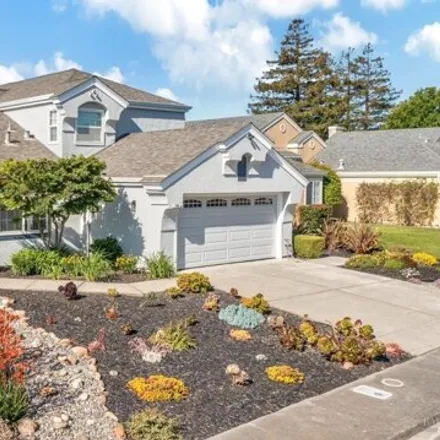
$1,05M
$1,05M
Available: Right Now
Welcome to your Southampton sanctuary! This 4-bedroom, 2.5-bath home boasts an updated kitchen and master bath with stunning quartz countertops. A versatile bonus room downstairs, featuring a sink, makes another great space to entertain. Outside, a s...

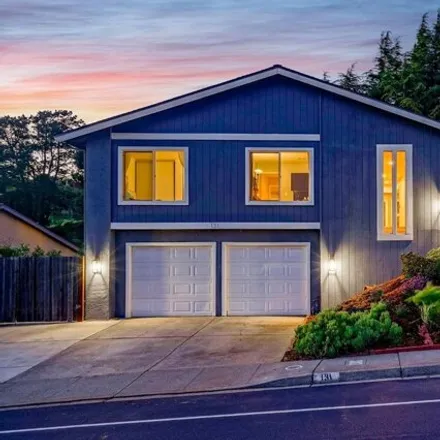
$1,19M
$1,19M
Available: Right Now
Stunning Remodeled Home with Water and Bridge Views! Approx$370, 000spent on improvements Bridgeview subdivision Art Studio added on lower level Newer Roof w/ Tesla Solar Panels Newly installed- Older model Air Conditioner Tankless water heater Engin...
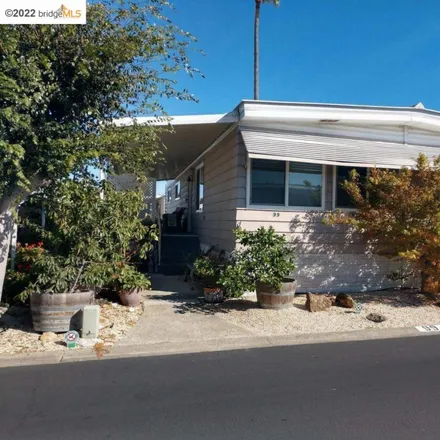
$310,000
$310,000
Available: Right Now
This adorable single level condo in the bayside community of Benicia, is a great opportunity for first time homebuyers or investors. 2 bedrooms 1 bath. Good size kitchen opened to living room. Ample storage/closet space. Nice patio backs to greenbelt...
$1,2M
$1,2M
Available: Right Now
1904 french acadian farm house Originally designed for comfort, yet reflects a timeless quiet serenity Home borders the 1400+ acres Carquinez Strait Shoreline Parklands! The mild year-round climate - pleasant and truly charming Port Costa comm...
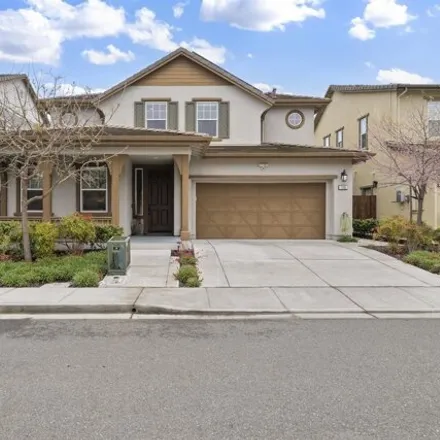
$969,000
$969,000
Available: Right Now
Welcome to your new home! This charming Southampton gem boasts four bedrooms, three bathrooms and is conveniently located near Matthew Turner Elementary School with just a 10-minute drive from downtown Benicia and its waterfront. Vibrant water-wise l...
$795,000
$795,000
Available: Right Now
This 4 bedroom, 2 bath home is located in a very desirable area in Benicia. This home has dual pane windows-noise reduction, central air and heating, and recessed lighting in the living room and family room/ kitchen. Vaulted ceilings, hardwood parque...
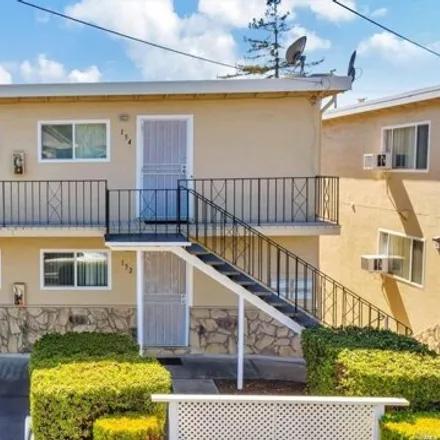
$1,5M
$1,5M
Available: Right Now
Next door identical 4plex is also available152-158 E ISt. Seller prefers to sell both buildings concurrently. Pride of ownership type units. Just walking distance from downtown Benicia. Very solid tenants and good rental income. Tenants pay gas and e...

$3,8M
$3,8M
Available: Right Now
Attractive corner lot 16-Unit contemporary Apartment Complex in a well-established and serene Benicia neighborhood with top-rated amenities including parks, schools, shopping and downtown close by. 1112 6th Street, which consists of 3 freestanding bu...
$799,000
$799,000
Available: Right Now
Welcome to 519 Hastings Dr, Benicia! This Single Story home has 3 bedrooms and 2 bathrooms with 1365'. Beautifully updated kitchen with stainless appliances, recessed lighting, quartz countertops, crown molding and tile flooring. This floor plan is g...
$849,000
$849,000
Available: Right Now
This stunning property is tucked away in the hills of Vallejo, with nearby parks and easy access to the780, 80and 680 freeways. The house is equipped with a fully paid-off solar panel system (~5kWp) and batteries for energy storage, providing substan...
$166,395
$166,395
Available: Right Now

$599,000
$599,000
Available: Right Now
$1,5M
$1,5M
Available: Right Now
Next door identical 4plex is also available152-158 E ISt. Seller prefers to sell both buildings concurrently. Pride of ownership type units. Just walking distance from downtoen Benicia. Very solid tenants and good rental income. Tenants pay gas and e...
$900,000
$900,000
Available: Right Now
Views, Views, Views!! Welcome the top of Benicia and the highly desirable Southampton neighborhood. This 4 bedroom and 3 full bathroom home is highlighted by spectacular panoramic views of the Carquinez Strait, Suisun Bay, Mount Diablo and the coasta...
Benicia
According to statistics, the population in Benicia, CA amounts to 28,011, which shows decline 1% compared to the previous year. The median age of the city’s residents is 45. The average household income is $95,225, shifting growth 9% from the past year, and the average property value in Benicia, CA growth 8% to $515,800 throughout the year.
| Population | 28,011 |
| Median Age | 44.9 |
| Poverty Rate | 7% |
| Household Income | $95,225 |
| Number Of Employees | 14,251 |
| Median Property Value | $515,800 |
Household Income
The average household income in Benicia, CA grew from $87,011 to $95,225 in the past year. This data is an estimate based upon 11,186 households in Benicia, CA . The chart below presents how household income is distributed in Benicia, CA in comparison to the revenue allocation amid households nationally.
Property Value
According to data from last year, the average property value in Benicia, CA shifted from $475,500 to $515,800 throughout the year. The subsequent graph indicates the share of properties in the given price range in Benicia, CA in comparison to the median property value in the same price segment across the country. According to the data, the greatest share of Benicia, CA properties falls in the '$500,000 to $749,999' range, which is higher than the most significant median property across the country.
Rent vs. Own
Property Taxes
One of the most important aspects for property owners is the amount of property taxes. This graph shows distribution of property taxes in Benicia, CA compared to median property taxes around the country. The prevalent amount of property taxes in Benicia, CA equals $3000, which is less than the national average.