Carson, CA, USA apartments for sale

$559,000
$559,000
Available: Right Now
Welcome to this beautifully maintained townhouse-style unit offering comfort and modern convenience in Gardena. Spanning1, 235square feet, this home boasts durable laminate floors and energy-efficient double-paned windows throughout. The remodeled ki...

$1,05M
$1,05M
Available: Right Now
Impeccably upgraded home nestled in Carson's picturesque residential area. This charming residence features 5 bedrooms, 4 full bathrooms, a modern kitchen with premium appliances with new dishwasher, new oven range with griddle and tastefully designe...
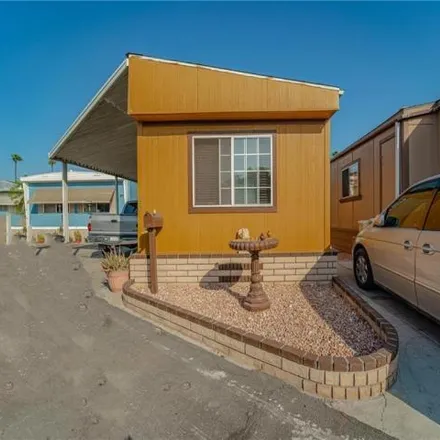
$129,999
$129,999
Available: Right Now
In the City of Carson, his is an exceptionally well-kept manufactured home! This two-bedroom, one-bathroom residence is ideal for first-time buyers that would like to have their own space. Laminate flooring throughout the house, a good-sized kitchen ...

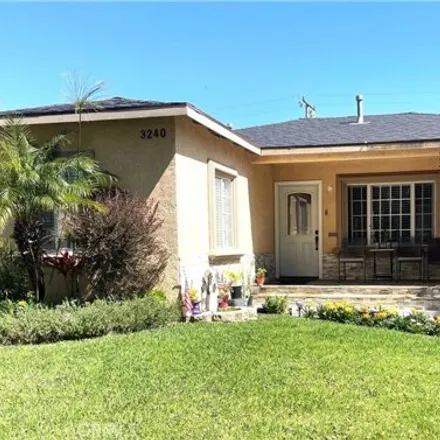
$829,950
$829,950
Available: Right Now
This beautifully updated single-family residence boasts1, 296square feet of comfortable living space, featuring 3 spacious bedrooms and 2 modern bathrooms. Perfectly positioned on a desirable corner lot, this home is located right across the street f...

$380,000
$380,000
Available: Right Now
Welcome to your South Bay oasis! This charming 1-bedroom, 1-bathroom condo offers the perfect blend of modern comfort and convenient location, making it an ideal retreat for the busy commuter seeking both relaxation and accessibility. Step inside to ...

$759,000
$759,000
Available: Right Now
Welcome to the highly sought after VEO community in Carson! This beautiful community offers resort-like living in a great central location. The community offers beautiful walking trails and landscaping, and wonderful amenities including a pool, spa, ...

$810,000
$810,000
Available: Right Now
Discover the charm of this hidden gem waiting for you to unleash your creativity to transform it to its original beauty. This home is located in a quiet tree- lined area of central Carson. Upon entering the home you will find the living room with ple...

$2,2M
$2,2M
Available: Right Now
Welcome to528 E.238th Place! A Triplex multi-family property! Features a front single family house with 3BR and3.5BTHand2231SFof living space with a 2 car detached garage, storage room and dual pane windows throughout! You are welcomed by the wood fe...

$2,2M
$2,2M
Available: Right Now
5 Unit apartment building located in the most desirable Carson neighborhood!!! All 3 bedrooms and 2 full baths in all 5 units. 6 garages can rent it out for extra income. Each unit has it own laundry room. and also has it own patio. Two units have it...
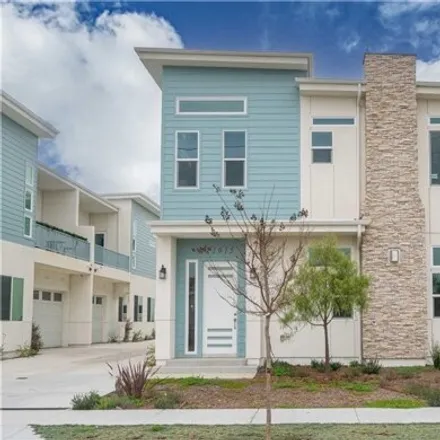
$949,999
$949,999
Available: Right Now
Introducing a sleek two-story townhome that epitomizes modern living. Situated in a prime location, this new construction property offers an airy, open-concept layout perfect for today's lifestyle. Enter the spacious living area flooded with natural ...

$720,000
$720,000
Available: Right Now
Well maintained Home in Prime Long Beach Location Welcome to your dream home or next investment opportunity! This beautiful 4-bedroom, 2-bathroom house offers everything you need for comfortable and convenient living in the heart of North Long Beach....

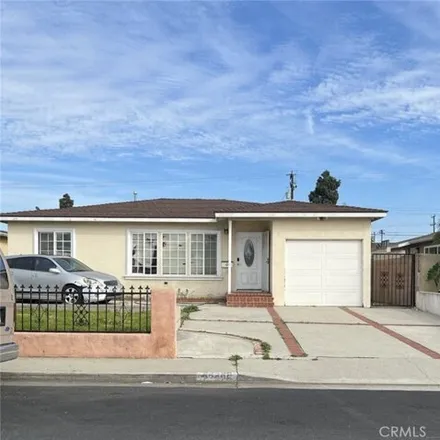
$840,000
$840,000
Available: Right Now
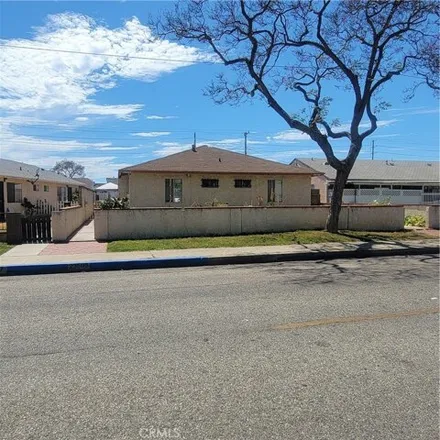
Nestled within the highly coveted and desirable neighborhood community of carson ; Welcome to this lovely single story family home that offers 4 bedrooms, 2 bathrooms, family room, living room with fireplace, open floor plan, and direct acc...

$799,995
$799,995
Available: Right Now
Excellent investment opportunity !!!... All cash purchase sale !!!!... Large, spacious 5 bedroom home with 3 bathrooms, family room with fireplace, formal dining room, step down formal living room, entrance foyer, enclosed patio and ...

$949,000
$949,000
Available: Right Now
Opportunity knocks at this rare, ~20, 000sfFLAT LOTwith an original 3 bedroom, 1 bathroom single family residence as well as a detached, 2 car garage. Both structures have additions. The rear of the lot backs to Sepulveda Blvd. and Dolores St. - each...

$874,900
$874,900
Available: Right Now
Great income property in the City Compton! This Triplex sits on a lot of8, 625sqft with a living area of2, 523sqft. Property presents 6 spacious bedrooms (2 per unit), 3 bath, parking garage, heating, and overall a comfortable living for all tenants ...

$899,000
$899,000
Available: Right Now
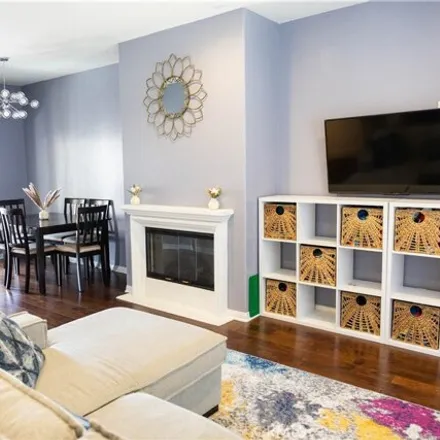
Welcome to this well-maintained 4-bedroom, 2.5-bath home in a peaceful Carson neighborhood. This inviting residence offers a perfect blend of comfort and convenience, making it an ideal choice for families. The spacious living area is bright and open...

$689,000
$689,000
Available: Right Now
This charming 2-bedroom, 1-bath home is ready for a new family. Nestled in a friendly neighborhood, this cozy abode is one of the lowest-priced homes in the area, offering an exceptional opportunity for first-time buyers or those looking to downsize....

$699,900
$699,900
Available: Right Now
Fantastic, loving, home Perfect for first time home buyer, large family, or investment opportunity... You can feel the holidays celebrated, and the loving energy the minute you walk through the front door Cheery hardwood floors, and tons of na...
$850,000
$850,000
Available: Right Now
Welcome to your dream home! This spacious gem offers comfort, style, and modern upgrades. Heres what makes it special: Generous Living Space with 1754 square feet, this home provides ample room for family gatherings, entertaining, and relaxation. Rec...
$799,000
$799,000
Available: Right Now
What's Hot on Sale? You ask! Are you ready to FIRE up!? ???? Here's what you have missed: Single-Level home. Welcome to Your Great Starter Home! The potential is here! Don't waste time searching! The possibilities are endless with your vision . ev...
$1,05M
$1,05M
Available: Right Now
Investment Opportunity in Prime Carson Location. Welcome to a rare opportunity to own a duplex in one of Carson's most coveted areas. This property presents an ideal opportunity for investors or homeowners seeking a versatile income property with pot...
$775,000
$775,000
Available: Right Now
Welcome to this charming 3 Bedroom, 2.5 Bathroom townhome in the heart of Carson, nestled within the Villa Andalucia gated community. Hardwood floors lead you to the living room, featuring a gas fireplace. Step out onto the connected balcony next to ...
Carson
According to statistics, the population in Carson, CA amounts to 92,927, which shows decline 0% compared to the previous year. The median age of the city’s residents is 39. The average household income is $75,517, shifting growth 2% from the past year, and the average property value in Carson, CA growth 10% to $402,500 throughout the year.
| Population | 92,927 |
| Median Age | 38.5 |
| Poverty Rate | 11% |
| Household Income | $75,517 |
| Number Of Employees | 43,755 |
| Median Property Value | $402,500 |
What is the Average Price of Apartments for Sale in Carson, CA?
| Month | Median Price |
|---|---|
| Jun 2024 |
$731,406
|
| May 2024 |
$737,219
|
| Apr 2024 |
$656,855
|
| Mar 2024 |
$656,855
|
| Feb 2024 |
$656,855
|
| Jan 2024 |
$656,855
|
| Month | Median Price |
|---|---|
| Jun 2024 |
$684,688
|
| May 2024 |
$769,194
|
| Apr 2024 |
$681,707
|
| Mar 2024 |
$681,707
|
| Feb 2024 |
$681,707
|
| Jan 2024 |
$681,707
|
Household Income
The average household income in Carson, CA grew from $73,829 to $75,517 in the past year. This data is an estimate based upon 25,381 households in Carson, CA . The chart below presents how household income is distributed in Carson, CA in comparison to the revenue allocation amid households nationally.
Property Value
According to data from last year, the average property value in Carson, CA shifted from $366,700 to $402,500 throughout the year. The subsequent graph indicates the share of properties in the given price range in Carson, CA in comparison to the median property value in the same price segment across the country. According to the data, the greatest share of Carson, CA properties falls in the '$400,000 to $499,999' range, which is higher than the most significant median property across the country.
Rent vs. Own
Property Taxes
One of the most important aspects for property owners is the amount of property taxes. This graph shows distribution of property taxes in Carson, CA compared to median property taxes around the country. The prevalent amount of property taxes in Carson, CA equals $3000, which is less than the national average.