Laguna Niguel, CA, USA apartments for rent
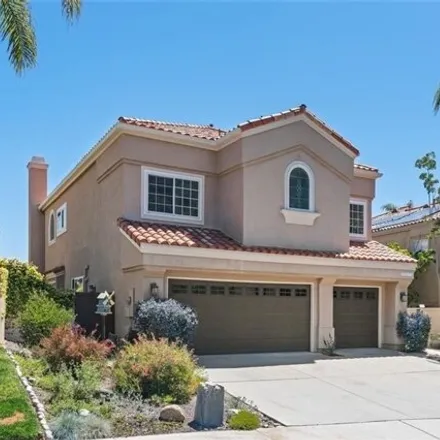
$8,095
Available: Right Now
Listed: 21/07/2024
30912 Belle Maison, California, 92677
Belle Maison Beauty. Enjoy tranquility on a single loaded street in this sought-after highly desirable community of Niguel Summit. Pristine and outstanding custom quality Mediterranean home with an awesome view of the Saddleback Mountains, valley, an...
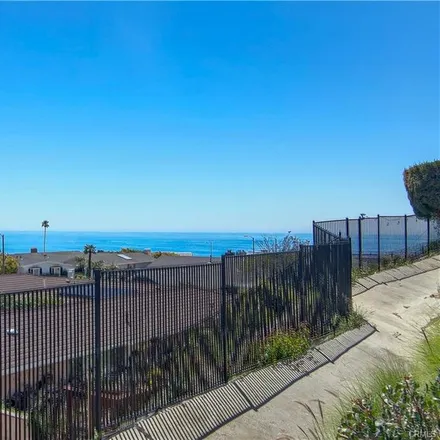
$8,000
Available: 05/05/2024
Listed: 23/07/2024
32321 Azores Road
This is a superb opportunity to live in the highly coveted Monarch Bay Terrace! This single-level 4 bed, 3.5 bath home boasts breathtaking ocean and mountain views from the private hillside deck, a private casita with its own separate entrance and ac...

$5,000
Available: 10/07/2024
Listed: 25/07/2024
47 Son Bon
Fantastic Marina Hills Monaco Home. This home features three bedrooms plus an added office/loft/room, a very large grassy backyard that is very private, plus high vaulted ceiling, making this a very open floor plan. Recently upgrades, carpet, kitchen...

$3,500
Available: Right Now
Listed: 21/07/2024
25802 Paseo De La Paz Unit B, San Juan Capistrano, California, 92675
Available NOW! This beautifully Furnished 1- bedroom, 1-bathroom home offers everything you need for a comfortable and luxurious stay. Boasting a private gated entry, a large manicured yard, an amazing patio with a built-in grill, and a privat...

$59,000
Available: Right Now
Listed: 21/07/2024
26 S La Senda Dr, California, 92651
Experience the allure of South Lagunas coveted Three Arch Bay in this newly furnished contemporary bluff front home. A private, guard-gated community offers exclusive access to a private beach and community amenities. Designed by Brion Jeanette and c...
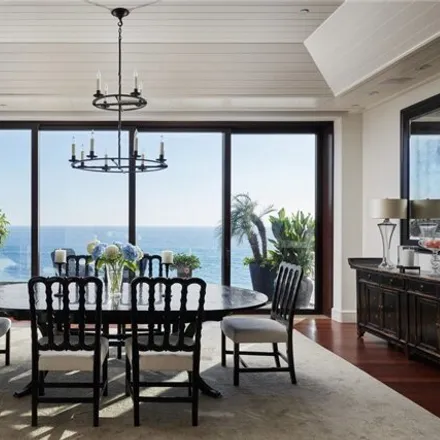
$90,000
Available: Right Now
Listed: 21/07/2024
31 Bay Dr, California, 92651
A one-of-a-kind beachfront estate home, with exclusive access to Three Arch Bay Beach - one of Southern California's most private beaches. Enjoy the ultimate luxury and security of this gated community, with 24-hour security and total privacy. Spread...

$6,950
Available: Right Now
Listed: 21/07/2024
19 Southern Hills Dr, Aliso Viejo, California, 92656
Welcome to your dream home nestled in the prestigious Westridge Community of Aliso Viejo, short distance from Canyon Vista Elementary!! This elegant single-family residence offers a perfect fusion of luxury and comfort, paired with breathtaking canyo...

$3,000
Available: Right Now
Listed: 23/07/2024
77 Cambria Ln Unit 3, Aliso Viejo, California, 92656
Don't miss out on this incredible leasing opportunity! This spacious, prime end unit features a generous living and dining area with sliding door access to a private deck, ideal for enjoying the serene landscaping. The kitchen dazzles with brand-new ...

$4,900
Available: 14/06/2024
Listed: 27/07/2024
29485 Port Royal Way
Welcome to this luxurious 2-bedroom, 2 1/2bathroom condo located in the heart of Laguna Niguel, where modern elegance meets coastal charm. This stunning residence boasts an expansive open floor plan, seamlessly integrating the living, dining, and kit...

$4,000
Available: Right Now
Listed: 25/07/2024
7 Pointe Sur Unit 124, California, 92677
Welcome to Niguel Pointe. One of Laguna Niguel's finest townhome communities. This home features an open floor plan with a large natural light-filled family room that leads to a large kitchen and dining area. The family room includes a gas burning fi...

$4,500
Available: Right Now
Listed: 21/07/2024
56 Corniche Dr Unit F, Dana Point, California, 92629
Welcome to your brand new renovated luxurious haven in the Prestigious Ritz Point next to Waldorf Astoria, Golf course, Dana Point Harbor, Doheny beach and Laguna Beach. Walking distance to beautiful Salt Creek Beach/Ritz Carlton. This brand new, exq...

$4,000
Available: Right Now
Listed: 23/07/2024
28646 Via Valdez, California, 92677
Upscale, move-in ready town-home located in the Costa Brava Community of Laguna Niguel. This is resort style living with a panoramic pool view! You will love this incredible floor plan with soaring ceilings , maple wood laminate flooring and addition...
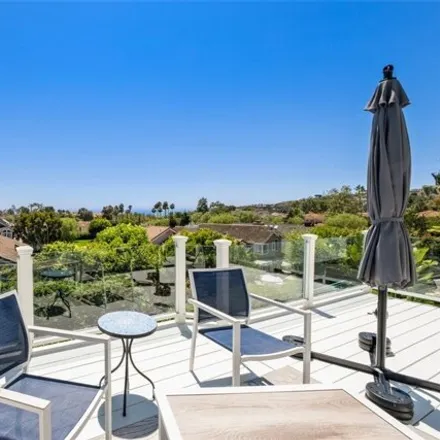
$7,950
Available: Right Now
Listed: 21/07/2024
23952 Dory Dr, California, 92677
Available January 5! Furnished rental and remodeled! Enjoy panoramic ocean views in this newly renovated and furnished 4 bedroom, 3 bathroom Niguel Coast home! The entrance invites you to an open and spacious living room/dining area featuring ...

$10,000
Available: Right Now
Listed: 21/07/2024
27186 Woodbluff Rd, California, 92653
5 bedroom plus an office! This turnkey beauty is ready and waiting for you! Remodeled and upgraded, located in the charming neighborhood of Moulton Ranch. Situated on one of the largest lots in the tract, youll enjoy the spacious backyard with fruit ...
$3,400
Available: Right Now
Listed: 21/07/2024
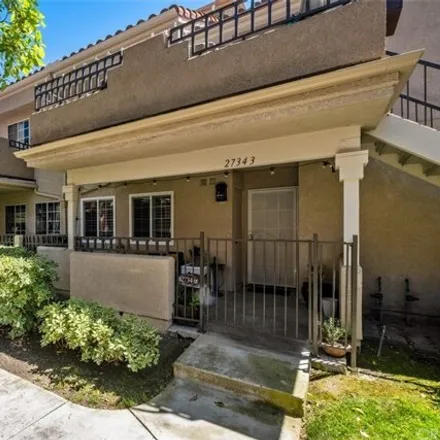
27343 Ryan Dr, California, 92677
Furnished - March 2nd! Pristine condition! Enjoy vacation or a second home in this fully furnished and stocked condo in gated Village Niguel Terrace II conveniently close to shops, restaurants, freeway, toll road and just a 5 minute drive to t...
$4,500
Available: Right Now
Listed: 21/07/2024
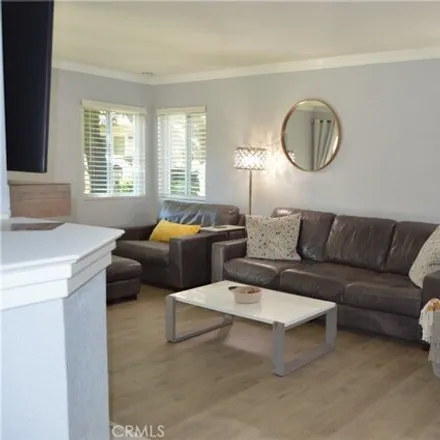
70 Corniche Dr Unit A, Dana Point, California, 92629
Welcome to Your New Furnished Home at Ritz Pointe community, 2beds/2Baths , Both Bedrooms Equipped with Walking Closets, Living Room/Kitchen/Master Bedroom all Have access to Cozy Patio. Following upgrades Carried out Recently: new flooring, New pain...

$7,000
Available: Right Now
Listed: 25/07/2024
28836 Aloma Ave, California, 92677
This home is unlike any other that you have seen. It is perfect for multi-generational living, has a large yard with mature landscaping, and the back yard is so private, you won't even know that you have neighbors. Upgraded with high end finishes tha...

$6,850
Available: Right Now
Listed: 25/07/2024
3 Danforth Ave, California, 92677
Stunning Southern California Rental Home: A Blend of Comfort, Luxury, and Natural Beauty Experience the perfect blend of comfort, luxury, and nature in this exquisitely maintained home, ideally situated near Southern California's most scenic attracti...
$3,995
Available: 17/07/2024
Listed: 23/07/2024
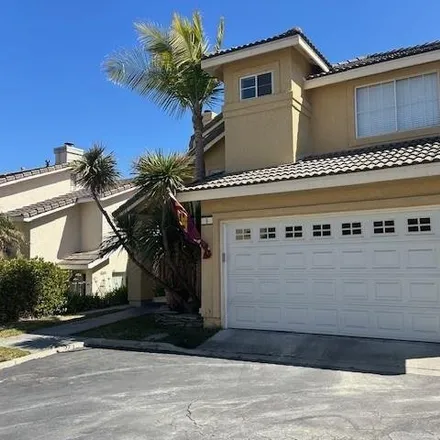
8 Ashbury Court
Gorgeous 3 Bed 2.5 Bath Home For Rent! Tucked Away in a Cul-de-Sac in the Heart of Aliso Viejo, This Home Features An Open Floor Plan with Vaulted Ceilings and Fireplace, Kitchen Comes Equipped with Gas Stove and Stainless-Steel Appliances, Refrigera...
$9,000
Available: Right Now
Listed: 23/07/2024
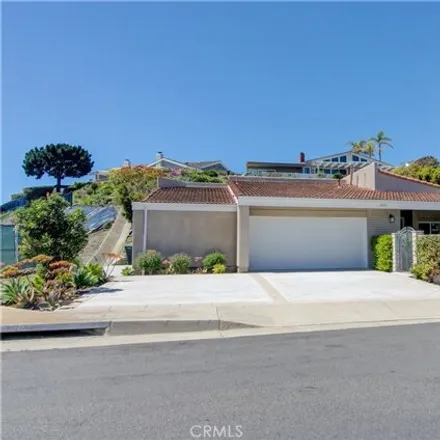
32321 Azores Rd, Dana Point, California, 92629
This is a superb opportunity to live in the highly coveted Monarch Bay Terrace! This single-level 4 bed, 3.5 bath home boasts breathtaking ocean and mountain views from the private hillside deck, a private casita with its own separate entrance and ac...

$2,995
Available: Right Now
Listed: 21/07/2024
22681 Oakgrove Unit 433, Aliso Viejo, California, 92656
Welcome to this Desirable Canyon Point Condominium with upgraded interior including granite counters, stainless steel appliances, inside laundry with included washer and dryer, closet built-ins and lovely oversized view deck. The property was recentl...

$5,900
Available: Right Now
Listed: 19/07/2024
3 Marblehead Pl, California, 92677
Located on a Quiet Cul-De-Sac street in the Desirable Beacon Hills Highlands Neighborhood. This detached Single family home isUPDATEDand in Meticulous condition with a Large living room w/fireplace, Large Main floor master bed...
Laguna Niguel
Laguna Niguel, CA has a population of 65,429, while the median age is 45. The household income in Laguna Niguel, CA is around $99,206. The homeownership rate among the residents is 71%. The median residential property value in Laguna Niguel, CA that you should keep in mind is $737,400.
| Population | 65,429 |
| Median Age | 44.7 |
| Poverty Rate | 7% |
| Household Income | $99,206 |
| Number Of Employees | 33,714 |
| Median Property Value | $737,400 |
What is the Average Rent for Laguna Niguel, CA Apartments?
The average rent for apartment in Laguna Niguel, CA: $6,140
(+9.1%)
| Month | Median Price |
|---|---|
| Jun 2024 |
$2,726
|
| May 2024 |
$2,732
|
| Apr 2024 |
$2,605
|
| Mar 2024 |
$2,605
|
| Feb 2024 |
$2,605
|
| Jan 2024 |
$2,605
|
| Month | Median Price |
|---|---|
| Jun 2024 |
$6,140
|
| May 2024 |
$5,629
|
| Apr 2024 |
$5,429
|
| Mar 2024 |
$6,980
|
| Feb 2024 |
$6,980
|
| Jan 2024 |
$6,980
|
Be informed and make custom offers based on median rent prices. However, keep in mind that the price may vary depending on the size and amenities of the apartments for rent.
Renter's FAQ About Laguna Niguel, CA
-
What are the most popular types of properties for rent in Laguna Niguel?
The most popular types of properties for rent in Laguna Niguel are apartments, houses, condos, rooms, townhouses, and lofts.
-
What are some common amenities available in rental properties in Laguna Niguel?
Rental properties in Laguna Niguel often come with amenities such as parking spaces, air conditioning, dishwashers, fireplaces, and access to pools.
-
What are the most important factors to consider when renting in Laguna Niguel?
When renting in Laguna Niguel, it's important to consider factors such as location (proximity to work, amenities, and schools), rental terms (lease duration, deposit, and utilities included), pet policies, maintenance responsibility, and community regulations (HOA rules, noise restrictions, etc.).
-
What are the largest employers in Laguna Niguel?
Some of the largest employers in Laguna Niguel include California State University, Fullerton, Capri Medical Group, Laguna Niguel Regional Park, and Marriott International. These employers provide a range of job opportunities for residents of the area.