San Clemente, CA, USA apartments for rent

$10,000
$10,000
Available: Right Now
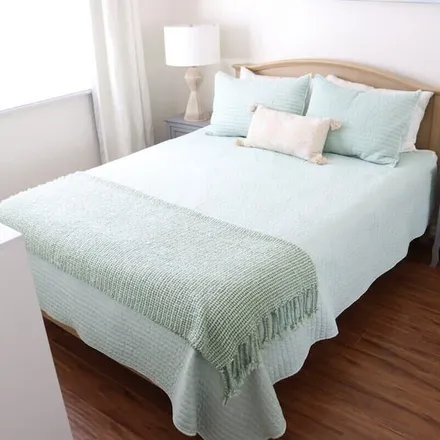
Welcome to 505 Via Cisco, San Clemente, CA your coastal oasis awaits! Nestled in a tranquil neighborhood, this charming property offers the perfect balance of privacy and convenience. The spacious floor plan features 4 bedrooms and 3 bathrooms, provi...

$5,800
$5,800
Available: Right Now
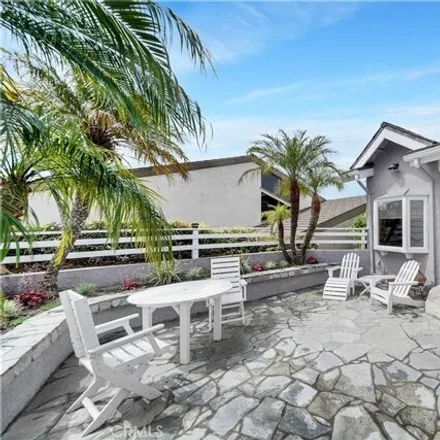
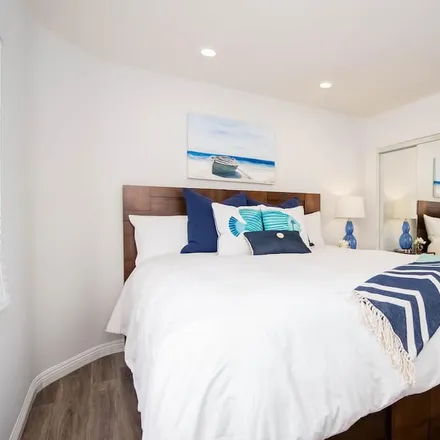
This beautifully remodeled San Clemente duplex, just 500 feet to the beach, offers a contemporary and airy ambiance with modern finishes and amenities. At1, 344square feet, this North Beach residence is one of only two units. The exterior features a ...

$40,000
$40,000
Available: Right Now
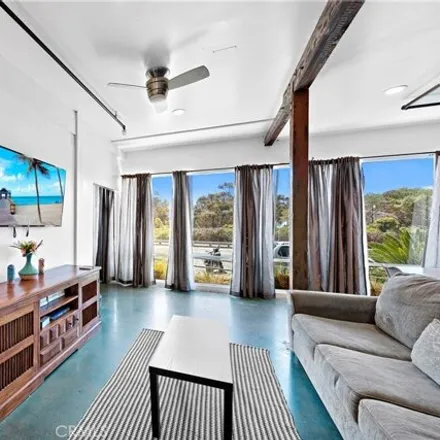
Perched above Lost Winds beach, this extraordinary beach front home redefines coastal luxury living with a thoughtful design that capitalizes on the magnificent views from every vantage point. The 4 bedroom, 5 bathroom home is a perfect luxury beach ...

$4,995
$4,995
Available: Right Now
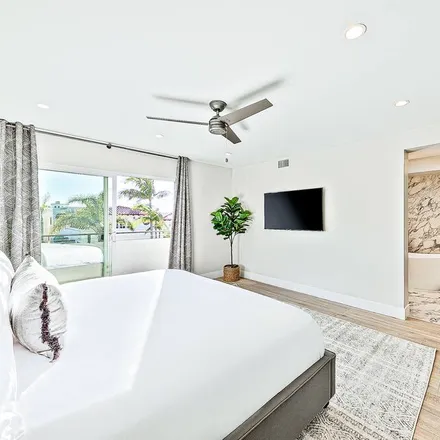
One of the best-kept secrets in South Orange County! A serene, gated community with lush, landscaped park-like environment situated around two ponds with waterfalls and a stream running between them. The grounds provide a haven for ducks, egrets, and...

$5,000
$5,000
Available: 01/08/2024
3 Beds 2 Baths - House26955 Calle Verano, Capistrano Beach, CA , United StatesGreat location in the golden triangle of the palisades in Capistrano Beach. 3 Bed/2 Bath home comes with Washer, Dryer, Refrigerator, and Dishwasher. Lockable carpo...

$4,600
$4,600
Available: 01/08/2024
Ocean FairwaysSan ClementeGolfers Paradise3 Bed / 2 Bath +/- 1425 Sq. Ft. Condo Ground Level with easy greenbelt garden entry. Steps (about 100) to San Clemente Municipal Golf Course, 3 blocks to SC State Park, 5 blocks to Ralphs. Golfers...

$5,000
$5,000
Available: 10/07/2024
Charming cottage in a well maintained 55+ community. This 2 bedroom 2 bathroom home is located in the perfect location with no attached walls. It has a private and quiet backyard with plenty of room to relax. There are excellent walking paths through...
$2,417
$2,417
Available: Right Now
The Trestles Suite is a highly updated self contained ground floor unit with its own kitchen and bathroom with some nice updates in place and air conditioning. It has high ceilings and a lofted large bed area. This unit is fully furnished with 2 quee...

$3,200
$3,200
Available: Right Now
Experience coastal living in this spacious 2 bdrm/1 ba in the desirable Southwest/Pier bowl area of San Clemente. This single-level unit features numerous modern upgrades including brand new carpet in the bedrooms and new paint. Large open living roo...
$7,900
$7,900
Available: Right Now
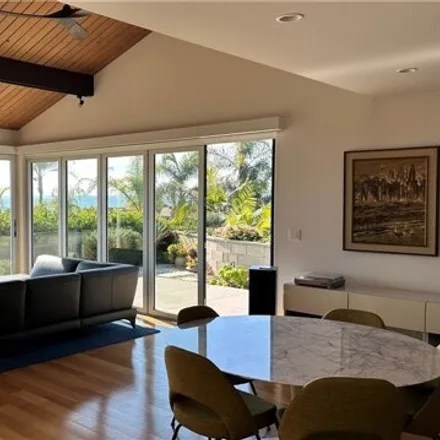
This home has captivating and spectacular, unobstructed Ocean, Catalina Island and SC Golf Course Views from almost every room! Featuring approx 3, 200sf including 3 Bedrooms, 3 Bathrooms Currently configured as 2 Bedrooms plus Home office with built...

$7,020
$7,020
Available: Right Now
San Clemente SunsetOur calendar is updated in real-time & our nightly rates are accurately displayed. Simply enter your desired dates and click 'Book Now!'Watch the sun sink into the horizon each evening at this one-bedroom condo in San Cleme...

$17,670
$17,670
Available: Right Now
Monthly Rental minimum stay at this gorgeous well appointed three bedroom three bath ocean view home is situated in Sea Summit, San Clemente near the high end outlet mall. Close proximity to restaurants trails beach and more. This home offers much pr...
$7,740
$7,740
Available: Right Now
Summary:Escape to our San Clemente 2nd story perch atop a beautiful duplex and enjoy a bike ride to the world-class waves of Trestles. With amazing weather all year our home is perfect for families, surfers, hikers, and bikers exploring Camp Pend...

$4,700
$4,700
Available: Right Now
Beautiful sit down ocean views of Catalina from his lovely 3 bedroom 2 1/2 bath condo located in the much desired Ocean Hills Community. Gorgeous upgraded kitchen to include granite counter tops, tiled back splash, newer cabinets, and stainless steel...

$6,000
$6,000
Available: Right Now
Single Story Home for Rent in a desirable area of Sunset Ridge neighborhood!! The house boost a spacious floor plan with plenty of natural light on a private corner lot. This amazing four bedroom, two bath home also features a 3 car garage. A welcomi...

$4,200
$4,200
Available: 23/07/2024
Spacious 3 bedroom, 2.5 baths, beautify upgraded throughout, painting, new appliances, all new bathrooms, new high grade laminate flooring throughout, new blinds, new lighting, private patio area off living room, 2 car garage with direct access: c...
$18,870
$18,870
Available: Right Now
Calafia Coast Condo 259 #1Our calendar is updated in real-time & our nightly rates are accurately displayed. Simply enter your desired dates and click 'Book Now!'This luxurious condo in the prestigious Seaside community of San Clemente is jus...
$15,000
$15,000
Available: Right Now
Available February 25th through April 20th, then again September 1st through November 24th. Experience the pinnacle of coastal living in this exquisitely updated Furnished 3- bedroom modern sanctuary nestled within the beautiful Riviera Distri...

$5,495
$5,495
Available: Right Now
This single story 3 Bedroom 3 bath recently remodeled and up dated home. Located high above the street within walking distance of Pines Park and the beach. All new flooring throughout, New heat and a/c split systems, entire new kitchen. Brand new was...

$14,500
$14,500
Available: Right Now
Experience breathtaking, unobstructed ocean views from this stunning estate in the exclusive guard-gated community of Connemara By The Sea. Situated on a private cul-de-sac on a19, 740sq ft lot, this home features 4 bedrooms, 3.5 bathrooms, and4, 164...
$28,500
$28,500
Available: Right Now
San Clemente - Hideaway FourplexOur calendar is updated in real-time & our nightly rates are accurately displayed. Simply enter your desired dates and click 'Book Now!'This fourplex is made up of four recently remodeled condos, all located in...

$21,990
$21,990
Available: Right Now
Experience coastal luxury in this 4-bed, 4-bath haven just steps from the beach. The spacious property features a large yard, jacuzzi, pool table, and piano. The open kitchen is perfect for family gatherings. Ideal for those seeking a blend of relaxa...
San Clemente
San Clemente, CA has a population of 65,226, while the median age is 43. The household income in San Clemente, CA is around $101,843. The homeownership rate among the residents is 66%. The median residential property value in San Clemente, CA that you should keep in mind is $849,300.
| Population | 65,226 |
| Median Age | 43.4 |
| Poverty Rate | 6% |
| Household Income | $101,843 |
| Number Of Employees | 32,042 |
| Median Property Value | $849,300 |
What is the Average Rent for San Clemente, CA Apartments?
The average rent for apartment in San Clemente, CA: $6,342
(+3.7%)
| Month | Median Price |
|---|---|
| Jun 2024 |
$2,784
|
| May 2024 |
$2,835
|
| Apr 2024 |
$2,607
|
| Mar 2024 |
$2,607
|
| Feb 2024 |
$2,607
|
| Jan 2024 |
$2,607
|
| Month | Median Price |
|---|---|
| Jun 2024 |
$6,342
|
| May 2024 |
$6,117
|
| Apr 2024 |
$6,569
|
| Mar 2024 |
$7,903
|
| Feb 2024 |
$7,903
|
| Jan 2024 |
$7,903
|
Be informed and make custom offers based on median rent prices. However, keep in mind that the price may vary depending on the size and amenities of the apartments for rent.
Renter's FAQ About San Clemente, CA
-
What types of properties are available for rent in San Clemente?
In San Clemente, you can find a variety of rental properties including apartments, houses, condos, townhouses, duplexes, rooms, and lofts.
-
What are the popular amenities available in rental properties in San Clemente?
Rental properties in San Clemente often offer amenities such as parking, dishwasher, air conditioning, balcony, and fireplace, among others. The availability of amenities may vary from property to property, so it's best to check the listing details.
-
Are there any tenant screening requirements in San Clemente?
Yes, landlords in San Clemente may conduct tenant screening which can include background checks, credit checks, and verification of income or employment. However, they must follow fair housing laws and adhere to regulations related to tenant screening.
-
Are there any additional fees associated with renting a place in San Clemente?
Yes, there may be additional fees associated with renting a place in San Clemente. These fees can include security deposits, pet deposits (if applicable), application fees, and sometimes utility fees. It's important to review the lease agreement and clarify any fee-related questions with the landlord.
-
Are there any rental incentives available for apartments in San Clemente?
Rental incentives such as move-in specials, discounted rent for a certain period, or waived application fees may be offered by some landlords or property management companies in San Clemente. It's worth checking the rental listings or contacting the property managers to inquire about any current incentives.
